

Swiss issuer 21Shares is launching a physically backed Dogecoin ETP on the Xetra trading platform. Xetra is Deutsche Börse’s leading electronic trading platform, through which most exchange-based securities trading in Germany is processed fully automatically.
The market reaction is already reflected in the data. So-called open interest, meaning the total value of all open futures contracts, rose by 25% in just 24 hours, according to Coinglass data. Over the past two weeks, the increase has already reached 46%. With a total value of 1.74 billion dollars, interest in the derivatives market has reached a level that may point to the return of institutional participants.
An increase in open interest alongside rising prices is often viewed by analysts as a bullish signal. Can DOGE continue to rise?
Dogecoin Price: What Is Driving DOGE Now
Over the past 24 hours, the price moved within a range of 0.10096 to 0.11200 US dollars — the high and low of the last six four-hour candles. The current closing price is 0.10695 dollars, slightly below the close 24 hours earlier at 0.10969 dollars. Market capitalization stands at 16,467,405,593 dollars, which still places the coin among liquid crypto assets.
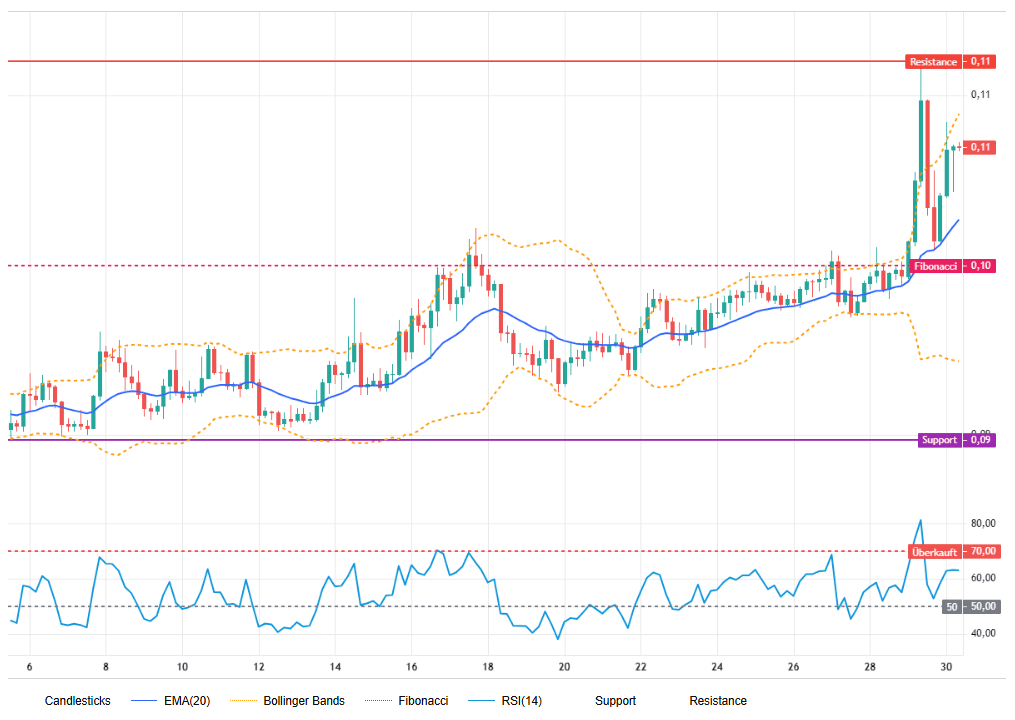
The price is trading above the EMA-20 at 0.10267 dollars and has shown a series of higher highs and higher lows since mid-April, although a short-term correction has been observed after the peak at 0.11200 dollars. Important support levels are located at 0.10096 and around 0.09860 dollars, while resistance levels are at 0.10700 and 0.11200 dollars. As long as the price remains above the EMA-20, the short-term market picture remains broadly bullish.
“Short-Term Uncertainty Remains Elevated”
The RSI is around 62.00 and indicates moderate upward momentum without signs of overbought conditions. The Momentum indicator histogram shows weakening acceleration, which may point to stabilization after the rally. The current Bollinger Bands width is approximately 0.01458 dollars — the difference between the upper and lower bands — indicating elevated but not extreme volatility. The market is in a consolidation phase after the breakout, so short-term uncertainty remains elevated.
Dogecoin Forecast: Why the Price Could Continue to Rise
The short-term forecast for Dogecoin as of April 30, 2026 remains bullish, although increased volatility is expected after the breakout toward 0.11200 dollars. Support levels are located at 0.10096 dollars — the latest confirmed low — and 0.09860 dollars, where the price has found support several times. Resistance levels are at 0.10700 and 0.11200 dollars.
Neutral Scenario
In the neutral scenario, the target price range is between 0.101 and 0.112 dollars, with a probability of 35%. The invalidation level is located at 0.099 dollars. Important price benchmarks include the EMA-20 at 0.10267 dollars, the Bollinger midline at 0.10162 dollars, and support at 0.10096 dollars.
The trigger for this scenario would be RSI stabilization in the 50–60 range, while the price consolidates around the EMA-20 and trading volume declines noticeably compared with the breakout phase.
Bullish Scenario
The bullish scenario assumes a target range from 0.112 to 0.14 dollars, with a 45% probability of realization. The invalidation level is located at 0.103 dollars. The key levels are a breakout above resistance at 0.11200 dollars and a target zone of 0.12500–0.14000 dollars, while the EMA-20 at 0.10267 dollars acts as support.
This scenario would be confirmed by a breakout and close above 0.11200 dollars on the four-hour timeframe, an RSI rise above 65, and increasing trading volume during the breakout.
Bearish Scenario
In the bearish scenario, a decline into the 0.089–0.098 dollar range is expected, with a probability of 20%. The invalidation level is located at 0.112 dollars. Important target zones are at 0.09800 dollars and below that around 0.08900 dollars.
The scenario is activated if the EMA-20 is lost with a close below 0.10267 dollars, the RSI falls below 50, and Momentum clearly turns negative. This may be accompanied by increased selling at higher volumes.
A sustained breakout above 0.11200 dollars would activate additional short-term buyer interest and open the way to targets above 0.12500 dollars. However, if the price falls below 0.10000 dollars, a stronger downward move toward 0.08900 dollars can be expected.
