

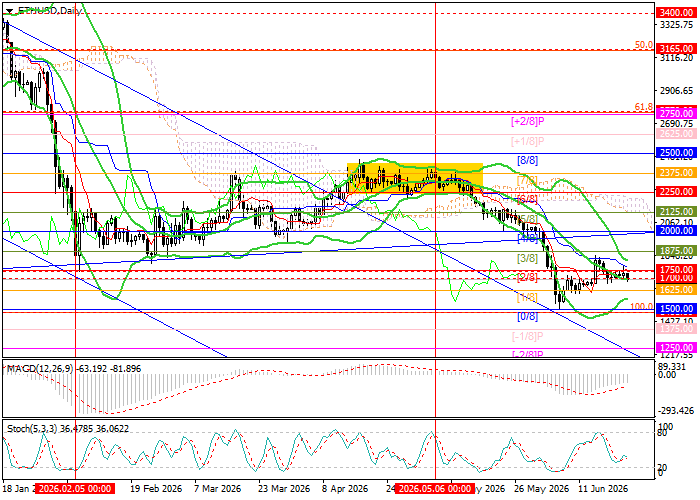
Technical indicators confirm the continuation of the current trend: the Bollinger Bands and Stochastic are turning downward, while the MACD histogram remains stable in negative territory. It is also worth noting that on the weekly chart, the Bollinger Bands are directed downward, confirming the relevance of the long-term bearish trend, while the price has still failed to break above the middle line.
Support and resistance levels
Resistance levels: 2000.00, 2250.00, 2500.00.
Support levels: 1700.00, 1500.00, 1375.00.
Trading scenarios and ETH/USD forecast
Short positions may be opened below 1650.00, with targets at 1500.00 and 1375.00, and a stop-loss at 1750.00. Expected implementation period: 5–7 days. Long positions may be opened above 2000.00, with targets at 2250.00 and 2500.00, and a stop-loss at 1870.00.
Main scenario
| Timeframe | Weekly |
| Recommendation | SELL STOP |
| Entry point | 1649.95 |
| Take Profit | 1500.00, 1375.00 |
| Stop Loss | 1750.00 |
| Key levels | 1375.00, 1500.00, 1700.00, 2000.00, 2250.00, 2500.00 |
Alternative scenario
| Recommendation | BUY STOP |
| Entry point | 2000.05 |
| Take Profit | 2250.00, 2500.00 |
| Stop Loss | 1870.00 |
| Key levels | 1375.00, 1500.00, 1700.00, 2000.00, 2250.00, 2500.00 |
