

Over the weekend, representatives of the Ansar Allah movement announced their readiness to join hostilities on the side of the Islamic Republic. As a result, in addition to the Strait of Hormuz, the Bab el-Mandeb Strait may also be blocked in the near future. This would force oil and other goods to be transported around Africa, significantly increasing delivery times and triggering higher prices. Meanwhile, Iran’s Islamic Revolutionary Guard Corps (IRGC) reported missile and drone strikes on two aluminum plants — EMAL, part of Emirates Global Aluminium in the United Arab Emirates, and ALBA in Bahrain — which may serve as an additional trigger for rising consumer prices. According to The Wall Street Journal, the White House is also considering a ground operation targeting Iranian nuclear facilities and the removal of enriched uranium, which could further worsen the situation in the region. Rising inflation risks may lead to prolonged tightening of U.S. Federal Reserve policy, accelerating capital flows from risk assets to traditional safe havens such as the U.S. dollar and precious metals. U.S. inflation remains above the 2.0% target (2.4% annual headline inflation and 2.5% core inflation in February), while the labor market remains stable. On Friday at 15:30 (GMT+2), the final March labor report will be released. If unemployment holds near 4.4% and employment increases by 56K, as forecasts suggest, policymakers are likely to maintain the current interest rate pause until early next year.
Additional pressure on Bitcoin comes from a potential pause in purchases by Strategy Inc., the largest public holder of the cryptocurrency. Since late December, CEO Michael Saylor has regularly reported new acquisitions, but last week no purchases were announced, raising concerns among market participants. Overall sentiment remains negative, as reflected by the Fear and Greed Index, which remains in the "extreme fear" zone at 8. However, analysts also note positive signals. Experts from Bloomberg and blockchain analytics firm Santiment suggest that while retail investors are actively selling digital assets, large institutional players are accumulating and holding them, which could support a medium-term bullish recovery.
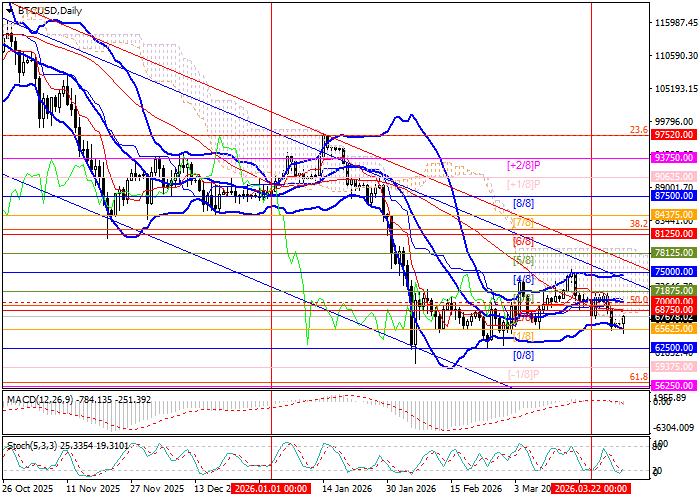
Support and Resistance Levels
Technically, BTC/USD remains within a broad sideways range of 65,625.00–75,000.00 (Murray [1/8]–[4/8]) and is currently near its lower boundary, after which it may continue toward targets at 59,375.00 (Murray [–1/8]) and 56,250.00 (Murray [–2/8]). A breakout above 70,000.00 (the Bollinger Bands midline and 50.0% Fibonacci retracement) would allow bulls to regain control and push prices toward 75,000.00 (Murray [4/8]) and 81,250.00 (Murray [6/8], 38.2% Fibonacci retracement).
Technical indicators provide mixed signals: Bollinger Bands remain flat, the MACD histogram is near the zero line with low volume, while Stochastic is attempting to reverse upward from oversold territory.
Resistance levels: 70,000.00, 75,000.00, 81,250.00.
Support levels: 65,625.00, 59,375.00, 56,250.00.
Trading Scenarios and BTC/USD Forecast
Short positions may be opened below 65,625.00 with targets at 59,375.00 and 56,250.00 and a stop-loss at 68,800.00. Implementation period: 5–7 days.
Long positions may be opened above 70,000.00 with targets at 75,000.00 and 81,250.00 and a stop-loss at 66,700.00.
Scenario
| Timeframe | Weekly |
| Recommendation | SELL STOP |
| Entry Point | 65600.00 |
| Take Profit | 59375.00, 56250.00 |
| Stop Loss | 68800.00 |
| Key Levels | 56250.00, 59375.00, 65625.00, 70000.00, 75000.00, 81250.00 |
Alternative Scenario
| Recommendation | BUY STOP |
| Entry Point | 70100.00 |
| Take Profit | 75000.00, 81250.00 |
| Stop Loss | 66700.00 |
| Key Levels | 56250.00, 59375.00, 65625.00, 70000.00, 75000.00, 81250.00 |
