

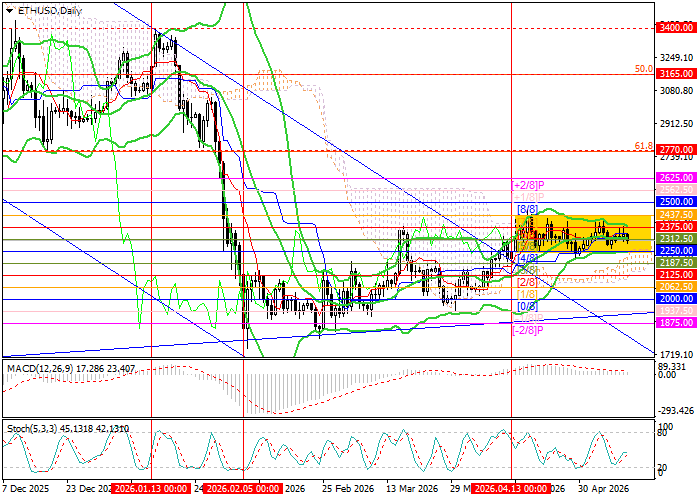
Technical indicators are sending mixed signals: the Bollinger Bands are flat, the MACD histogram remains stable in positive territory, while the Stochastic has turned upward from the oversold zone. It is also worth noting that on the weekly chart the Bollinger Bands are pointing downward and there are signs of a developing flag pattern; nevertheless, a breakout above 2500.00 (Bollinger Bands middle line, W1) could signal a change in the current trend.
Support and Resistance Levels
Resistance levels: 2500.00, 2770.00, 3165.00, 3400.00.
Support levels: 2250.00, 2000.00, 1875.00, 1481.60.
ETH/USD Trading Scenarios and Price Forecast
Long positions should be considered above 2500.00, targeting 2770.00, 3165.00, and 3400.00, with a stop-loss at 2350.00. Time horizon: 5–7 days.
Short positions should be considered below 2250.00, targeting 2000.00, 1875.00, and 1481.60, with a stop-loss at 2300.00.
| Scenario | |
|---|---|
| Timeframe | Weekly |
| Recommendation | BUY STOP |
| Entry Point | 2530.00 |
| Take Profit | 2770.00, 3165.00, 3400.00 |
| Stop Loss | 2350.00 |
| Key Levels | 1481.60, 1875.00, 2000.00, 2250.00, 2500.00, 2770.00, 3165.00, 3400.00 |
| Alternative Scenario | |
|---|---|
| Recommendation | SELL STOP |
| Entry Point | 2210.00 |
| Take Profit | 2000.00, 1875.00, 1481.60 |
| Stop Loss | 2300.00 |
| Key Levels | 1481.60, 1875.00, 2000.00, 2250.00, 2500.00, 2770.00, 3165.00, 3400.00 |
