

US officials said the administration had temporarily paused strikes on Iran after the number of available targets narrowed and concerns increased over ammunition stocks. Iranian officials subsequently indicated that Tehran would also suspend its attacks for as long as the US pause remained in place. The reduction in hostilities raised hopes that diplomatic negotiations could resume and added pressure on the US dollar.
Nevertheless, gains in “digital gold” remain limited, as traders are reluctant to take active positions ahead of this week’s key events. The US Federal Reserve will announce its interest rate decision on Wednesday at 20:00 (GMT+2). Analysts widely expect the target range to remain unchanged at 3.50–3.75%, meaning that attention will primarily focus on officials’ comments for indications regarding the timing of further monetary tightening. According to the CME FedWatch Tool, markets are currently pricing in the possibility of additional rate increases in September and December.
In addition, Apple Inc., Microsoft Corp., Meta Platforms Inc. and Amazon.com Inc. are scheduled to publish their corporate financial results during the week. If their guidance on free cash flow and spending on artificial intelligence technology disappoints the market, some investment flows could rotate out of technology stocks and into cryptocurrencies.
Local pressure on digital assets is also coming from BitMart’s planned shutdown, with the exchange expected to formally cease platform operations on January 31, 2027. The market is also assessing a security incident involving unauthorised access to wallets belonging to stablecoin payments company Triple-A. The company said that only its own treasury assets were affected and that client funds were not exposed.
Overall, market conditions remain challenging, as reflected by the Crypto Fear and Greed Index remaining in the “Fear” zone at 30.
Support and Resistance Levels
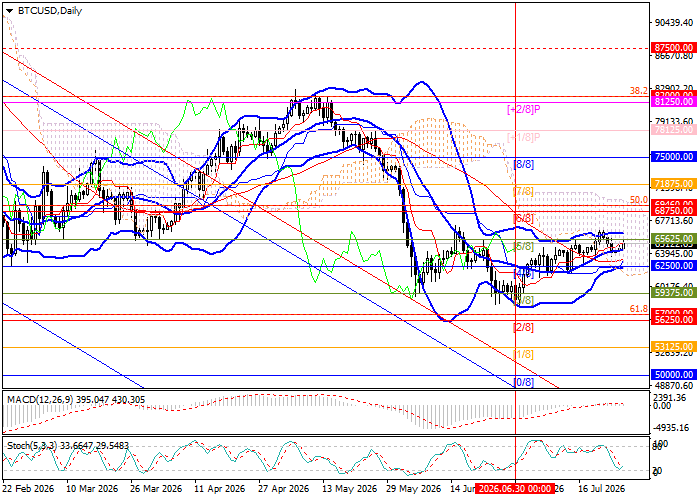
The trading instrument is developing an upward correction and testing 65,625.00 (Murrey level [5/8]). A breakout above this level could support further gains toward 69,460.00 (50.0% Fibonacci retracement) and 75,000.00 (Murrey level [8/8]). However, a move below the middle line of the Bollinger Bands at 62,500.00 (Murrey level [4/8]) could lead to a decline toward 57,000.00 (61.8% Fibonacci retracement) and 50,000.00 (Murrey level [0/8]).
Technical indicators maintain a buy signal: the Bollinger Bands are turning upward, the MACD histogram remains close to the zero line with limited momentum, while the Stochastic Oscillator has reached oversold territory and may reverse upward.
Resistance levels: 65,625.00, 69,460.00, 75,000.00.
Support levels: 62,500.00, 57,000.00, 50,000.00.
BTC/USD Trading Scenarios and Price Forecast
Long positions may be considered above 65,625.00, with targets at 69,460.00 and 75,000.00 and a stop-loss at 63,000.00. Implementation period: 5–7 days.
Short positions may be considered below 62,500.00, with targets at 57,000.00 and 50,000.00 and a stop-loss at 65,000.00.
Scenario
| Timeframe | Weekly |
| Recommendation | BUY STOP |
| Entry Point | 65,695.00 |
| Take Profit | 69,460.00, 75,000.00 |
| Stop Loss | 63,000.00 |
| Key Levels | 50,000.00, 57,000.00, 62,500.00, 65,625.00, 69,460.00, 75,000.00 |
Alternative Scenario
| Recommendation | SELL STOP |
| Entry Point | 62,450.00 |
| Take Profit | 57,000.00, 50,000.00 |
| Stop Loss | 65,000.00 |
| Key Levels | 50,000.00, 57,000.00, 62,500.00, 65,625.00, 69,460.00, 75,000.00 |
