

Overall, the sector continues to be influenced by several opposing factors. Pressure on the market is coming from the escalation of the Middle East conflict, which has prompted investors to move capital into safe-haven assets such as the US dollar amid concerns about a potential global economic slowdown caused by rising energy prices. The US currency is also receiving additional support from the rhetoric of the Federal Reserve, which may refrain from easing monetary policy in the medium term while consumer inflation remains at 2.4% and producer prices stand at 2.9% as of January. Locally, the asset was also influenced by comments from Japanese Prime Minister Sanae Takaichi, who stated that she has no connection to the SANAE meme coin issued on the Solana blockchain. According to the official, she had only heard about the existence of the token and had not endorsed the project. Following these remarks, the token’s value dropped sharply, and its market capitalization declined from $27.72 million to $6.00 million.
On the other hand, further declines in cryptocurrency prices are being limited by market expectations regarding the potential adoption of the US cryptocurrency market structure bill known as CLARITY. The initiative recently received support from President Donald Trump, who emphasized on the Truth Social platform that the legislation is necessary for the development of the crypto industry in the United States and criticized organizations opposing its approval. Financial institutions, however, fear that allowing digital exchanges to offer yield on stablecoins could lead to a significant outflow of deposits from the banking sector. The intervention of the US president has nevertheless encouraged traders to expect the bill to come into force as early as the beginning of summer, potentially attracting new institutional capital into the market. Over the last three sessions, the balance of Bitcoin ETFs has increased by $1.145 billion, while the Crypto Fear & Greed Index has risen to 22, remaining in the “extreme fear” zone.
Support and resistance levels
The trading instrument remains within the sideways range of 91.00–75.00. A consolidation above the resistance zone of 107.40–112.50 (Fibonacci retracement 61.8%, Murray level [4/8]) may lead to further growth toward the targets of 150.00 (Murray level [8/8]) and 162.50 (Murray level [+1/8], Fibonacci retracement 38.2%). However, if the price breaks below the lower Bollinger Band at 75.00 (Murray level [2/8]), a decline toward 50.00 (Murray level [0/8]) and 25.00 (Murray level [–1/8]) becomes likely.
Technical indicators do not yet provide a unified signal. Bollinger Bands remain horizontal, the Stochastic oscillator is moving upward but is approaching the overbought zone, while the MACD histogram is preparing to move into positive territory.
Resistance levels: 112.50, 150.00, 162.50.
Support levels: 75.00, 50.00, 25.00.
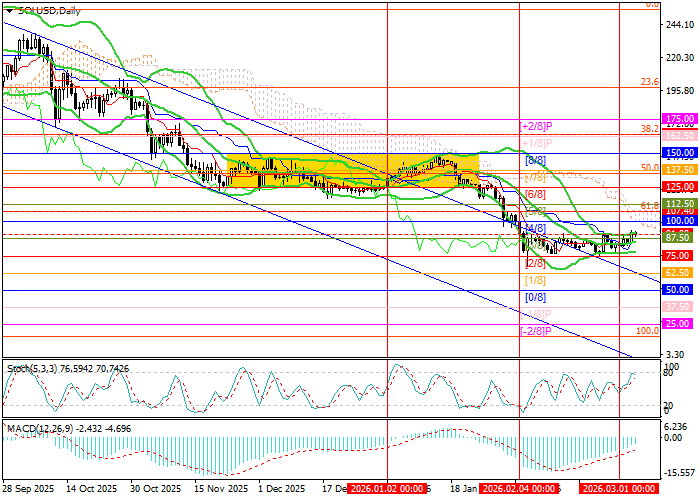
Trading scenarios and SOL/USD forecast
Long positions can be opened above the level of 112.50 with targets at 150.00 and 162.50 and a stop-loss at 90.90. Implementation period: 5–7 days.
Short positions can be opened below the level of 75.00 with targets at 50.00 and 25.00 and a stop-loss at 90.00.
Scenario
| Timeframe | Weekly |
| Recommendation | BUY STOP |
| Entry Point | 112.55 |
| Take Profit | 150.00, 162.50 |
| Stop Loss | 90.90 |
| Key Levels | 25.00, 50.00, 75.00, 112.50, 150.00, 162.50 |
Alternative Scenario
| Recommendation | SELL STOP |
| Entry Point | 74.95 |
| Take Profit | 50.00, 25.00 |
| Stop Loss | 90.00 |
| Key Levels | 25.00, 50.00, 75.00, 112.50, 150.00, 162.50 |
