

Analysts from Galaxy Digital’s research division note that a combination of macroeconomic conditions and market imbalances significantly complicates the construction of predictive models for “digital gold.” The sector is simultaneously facing pressure from political risks, elevated economic uncertainty, and the absence of a clearly defined trend among the largest cryptocurrencies by market capitalization, which typically serve as reference points for stablecoins.
According to the experts, the coming year could become one of the most challenging periods for the industry. This view is reflected in Galaxy Digital’s report on the outlook for cryptocurrencies, the DeFi sector, and artificial intelligence (AI) solutions, which separately examines the scale of institutional participation and ongoing structural transformations in the market.
At the current stage, Galaxy Digital believes the sector remains in a pronounced bearish trend. Bitcoin has so far been unable to form a sustainable upward impulse, as confirmed by its failure to consolidate above the 100,000.00–105,000.00 range. After testing a local high near 126,000.00, the price has already declined by more than 30%, and analysts do not rule out that this may only mark the beginning of a broader corrective cycle.
Meanwhile, Bloomberg Intelligence senior commodity strategist Mike McGlone allows for a potential return toward the 10,000.00 area. This would imply a decline of nearly 90% from current levels and a possible contraction of the total crypto market capitalization from approximately $3.0 trillion to $300 billion.
This scenario could be linked to a phase of “post-inflationary deflation” and a sharp sell-off in high-risk cryptocurrencies, many of which lack a fundamental correlation with real assets. McGlone draws a parallel with the U.S. equity market in 2007, when the Federal Reserve’s rate cuts amid global economic uncertainty failed to prevent a subsequent drop of more than 50% in asset values and the onset of the 2008 global financial crisis.
At the same time, according to data from the analytics service SoSoValue, the combined net outflow from eleven spot Bitcoin ETFs in December amounted to $1.09 billion, extending the negative trend from the previous month, when outflows reached $3.48 billion. This coincided with a 20% price correction over the same period and points to a decline in institutional interest in “digital gold.”
Support and resistance levels
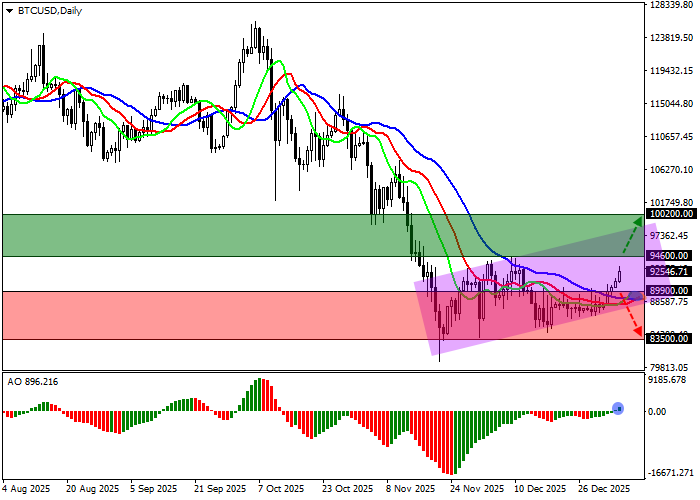
On the daily chart, the asset continues to trade within a corrective trend, once again moving away from the support line of the ascending channel at 100,200.00–88,600.00 as part of another corrective wave.
Technical indicators suggest a possible reversal: the fast EMAs in the Alligator indicator have crossed above the signal line from below and are beginning to widen the trading range, while the AO histogram remains in the buy zone but has yet to move decisively higher from the zero line.
Resistance levels: 94,600.00, 100,200.00.
Support levels: 89,900.00, 83,500.00.
Trading scenarios and BTC/USD forecast
Long positions may be considered after the price consolidates above 94,600.00, with a target at 100,200.00. Stop-loss: 92,000.00. Time horizon: 7 days or longer.
Short positions may be considered after the price consolidates below 89,900.00, with a target at 83,500.00. Stop-loss: 91,000.00.
Scenario
| Timeframe | Weekly |
| Recommendation | BUY STOP |
| Entry point | 94,600.00 |
| Take Profit | 100,200.00 |
| Stop Loss | 92,000.00 |
| Key levels | 83,500.00, 89,900.00, 94,600.00, 100,200.00 |
Alternative scenario
| Recommendation | SELL STOP |
| Entry point | 89,900.00 |
| Take Profit | 83,500.00 |
| Stop Loss | 91,000.00 |
| Key levels | 83,500.00, 89,900.00, 94,600.00, 100,200.00 |
