

Investor caution was further heightened by a new initiative from U.S. President Donald Trump to impose a $100,000 fee on H-1B visas for highly skilled foreign workers. Experts fear these measures could negatively affect technology and financial firms and indirectly impact the digital asset industry, given its heavy reliance on foreign specialists. However, the fee would apply only to new applicants, not to those renewing existing visas.
Still, the current BTC/USD correction does not yet appear sustainable, as institutional sentiment toward cryptocurrencies remains positive. This is confirmed by continued inflows into Bitcoin ETFs, which totaled $886.5 million last week. Additional support for non-dollar assets is also likely from further monetary easing by the Fed. On Friday at 14:30 (GMT+2), August core PCE inflation data will be released, with forecasts pointing to a slowdown from 2.9% to 2.7%. If confirmed, it would increase the probability of deeper rate cuts, potentially fueling a new bullish leg for Bitcoin.
Support and Resistance Levels
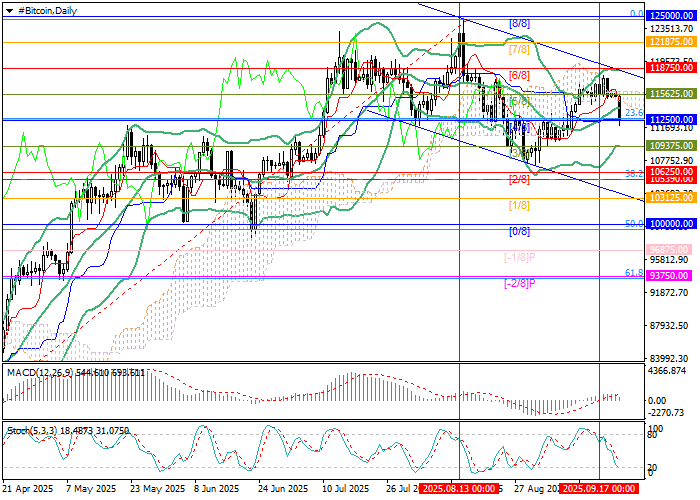
The chart shows signs of forming a short-term descending channel: a break below 112,500.00 (Murray [4/8], 23.6% Fibonacci retracement) could extend the decline toward 109,375.00 (Murray [3/8]) and 105,390.00 (38.2% Fibonacci retracement). Conversely, a breakout above 115,625.00 (Murray [5/8]) would resume the uptrend, opening the way toward 121,875.00 (Murray [7/8]) and 125,000.00 (Murray [8/8]).
Technical indicators are mixed: Bollinger Bands are turning upward, the Stochastic has entered oversold territory and may reverse higher, but MACD is preparing to cross into negative territory.
Resistance levels: 115,625.00, 121,875.00, 125,000.00.
Support levels: 112,500.00, 109,375.00, 105,390.00.
Bitcoin Trading Scenarios and Outlook
Short positions are recommended below 112,500.00 with targets at 109,375.00 and 105,390.00, and a stop-loss at 114,600.00. Time horizon: 5–7 days.
Long positions may be considered above 115,625.00 with targets at 121,875.00 and 125,000.00, and a stop-loss at 113,100.00.
Scenario
| Timeframe | Weekly |
| Recommendation | SELL STOP |
| Entry Point | 112,499.95 |
| Take Profit | 109,375.00, 105,390.00 |
| Stop Loss | 114,600.00 |
| Key Levels | 105,390.00, 109,375.00, 112,500.00, 115,625.00, 121,875.00, 125,000.00 |
Alternative Scenario
| Recommendation | BUY STOP |
| Entry Point | 115,625.05 |
| Take Profit | 121,875.00, 125,000.00 |
| Stop Loss | 113,100.00 |
| Key Levels | 105,390.00, 109,375.00, 112,500.00, 115,625.00, 121,875.00, 125,000.00 |