

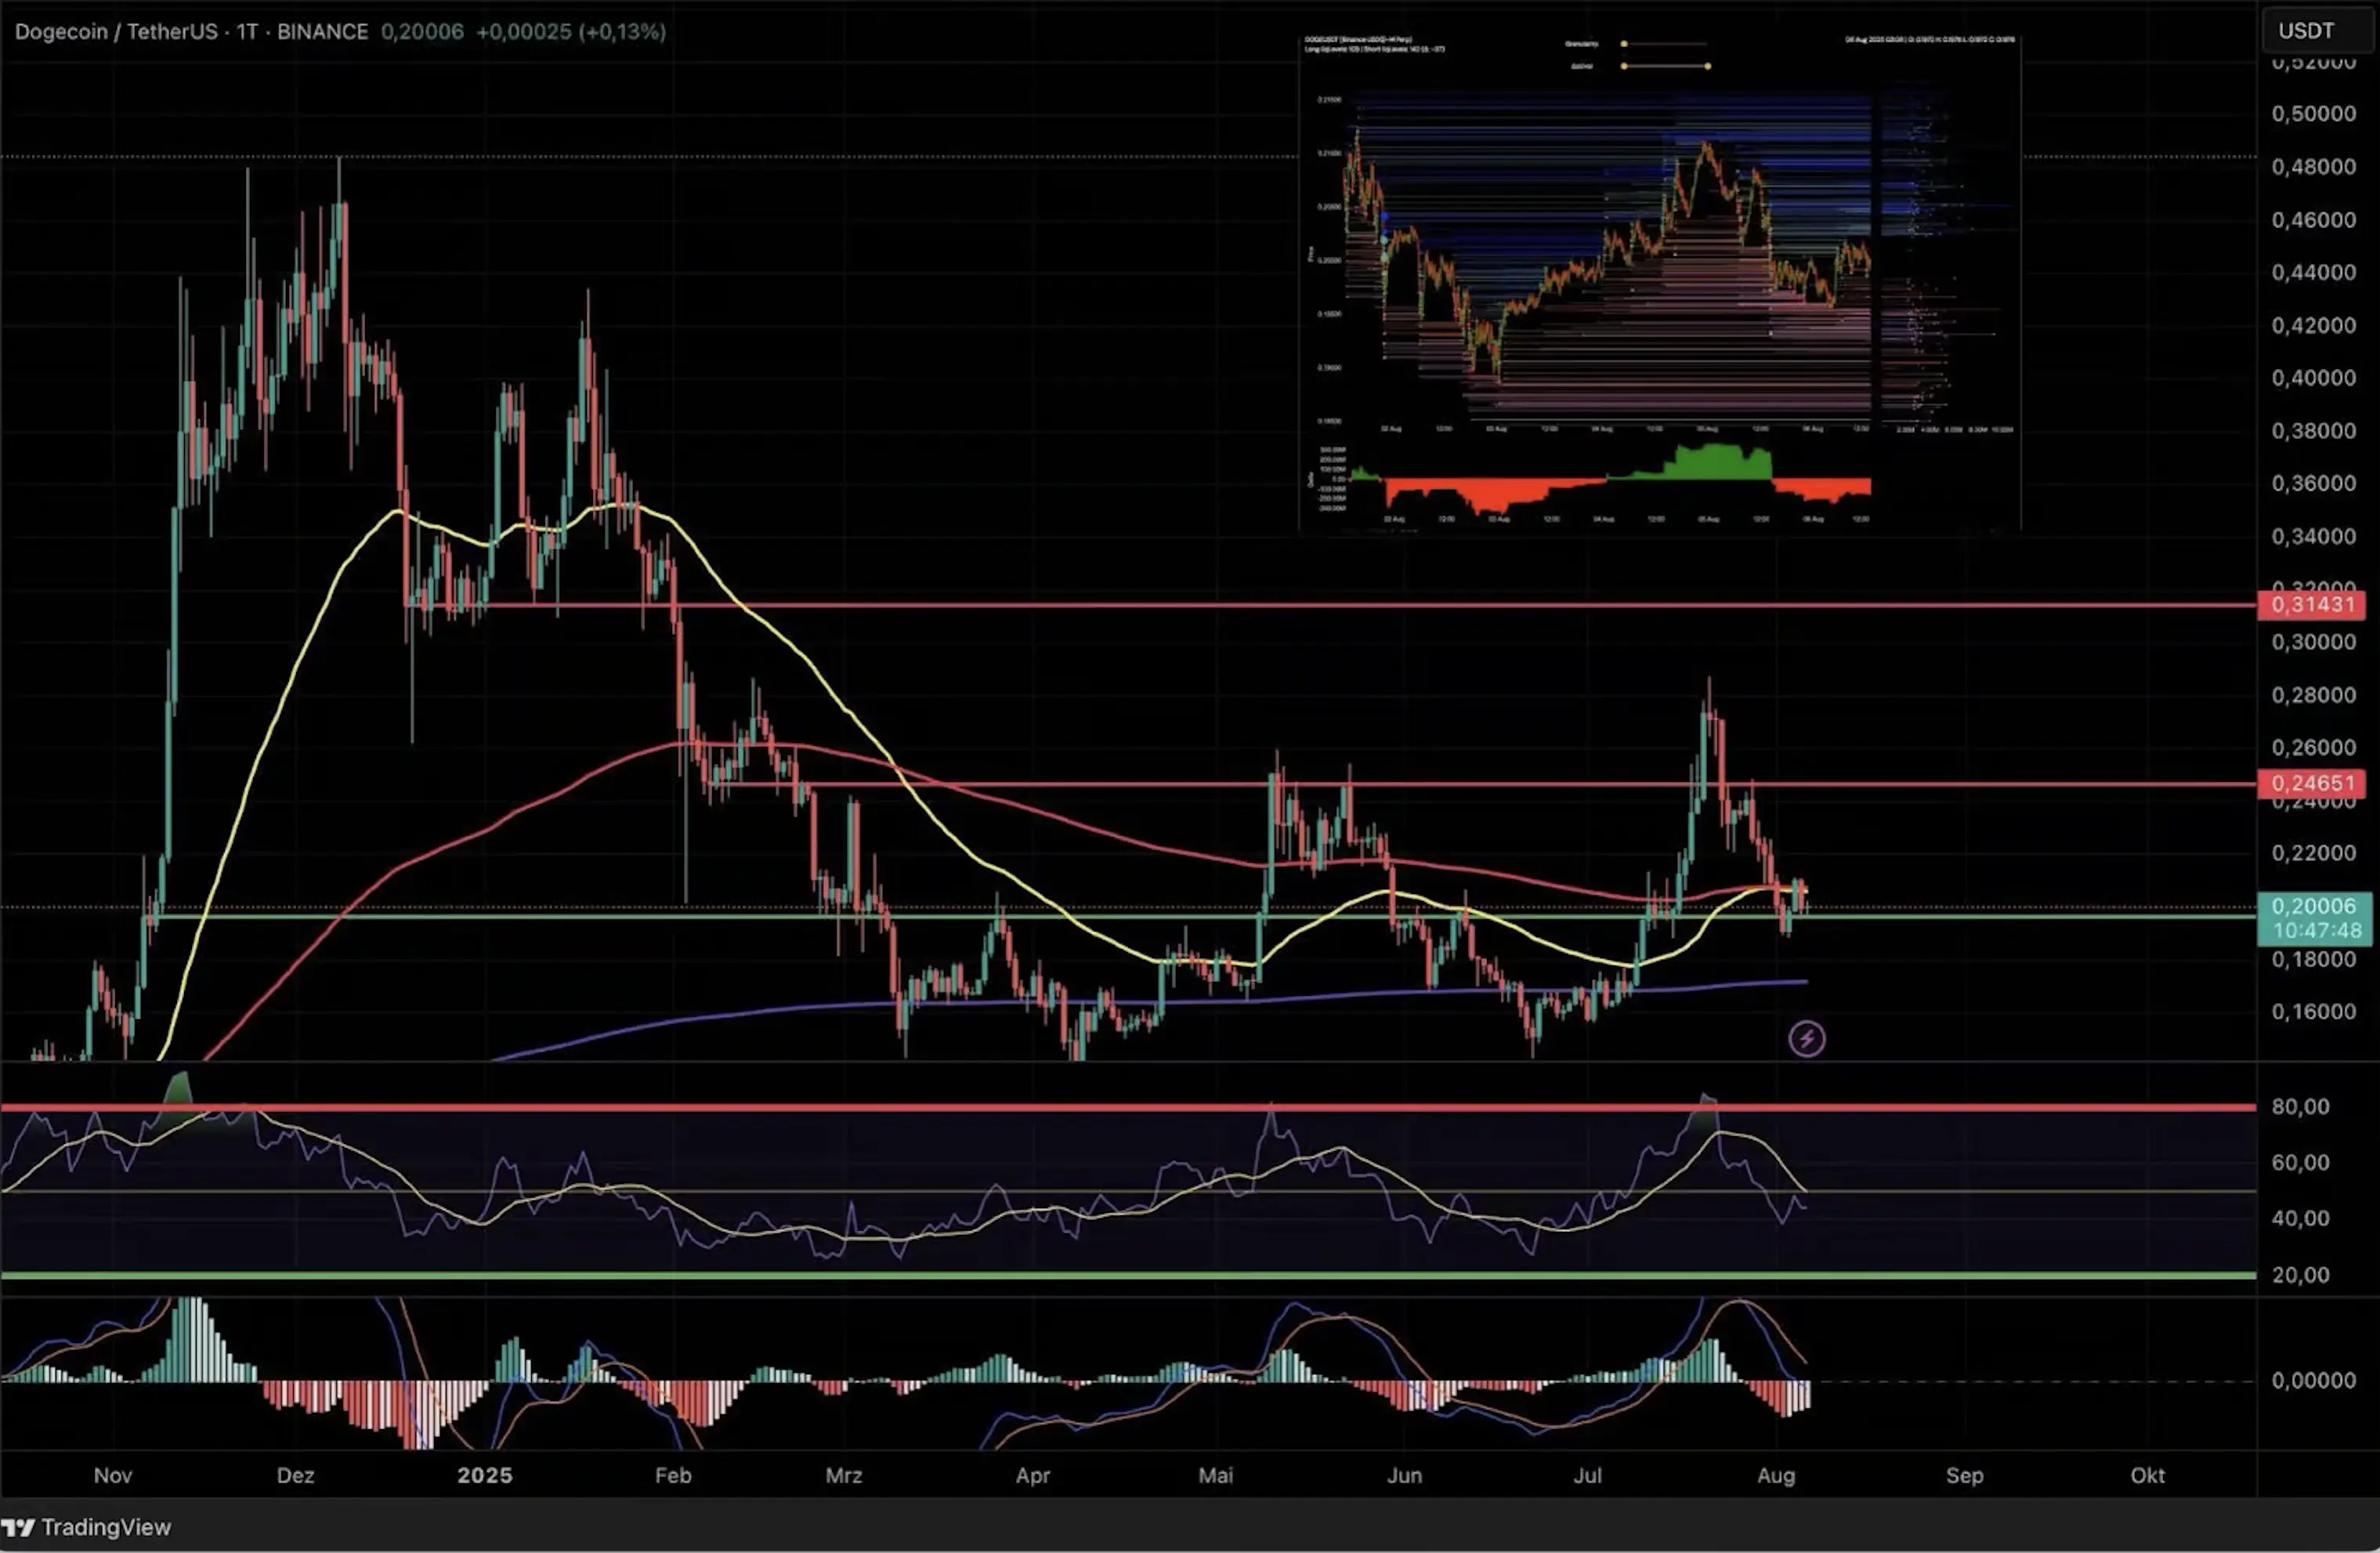
Dogecoin (DOGE) has arrived at a crucial crossroads following a sector-wide sell-off sparked by Bitcoin's pullback to its 50-day EMA. The price fell sharply, testing the green support zone at $0.20—a level now reinforced by the intersection of the 50-day and 200-day exponential moving averages (EMA). This confluence zone is critical: maintaining it could fuel a renewed bullish attempt toward higher levels, while a decisive break below would likely trigger a deeper correction.
The MACD indicator suggests that downward momentum is waning, hinting at an emerging stabilization. Meanwhile, the RSI hovers just above the neutral 50 level, preserving the underlying uptrend—though a sustained move below $0.20 would undermine this structure and open the door to further losses.
Importantly, DOGE’s technical structure remains closely linked to Bitcoin’s trajectory. If BTC stabilizes at its current range, DOGE could see a quick rebound toward the $0.24 resistance zone—a key hurdle from a technical perspective. This level represents the next upside objective for bullish traders.
 Dogecoin: Support, resistance and key EMAs in focus
At present, DOGE is consolidating above a pivotal technical foundation. The blend of converging EMAs, a stabilizing RSI, and receding MACD selling pressure all point to a possible bullish reversal—so long as broader crypto markets avoid further sell-offs. On the downside, breaching $0.20 would likely spark new lows as stop-losses are triggered.
4-Hour Chart: Sideways Structure and an Impending Decision
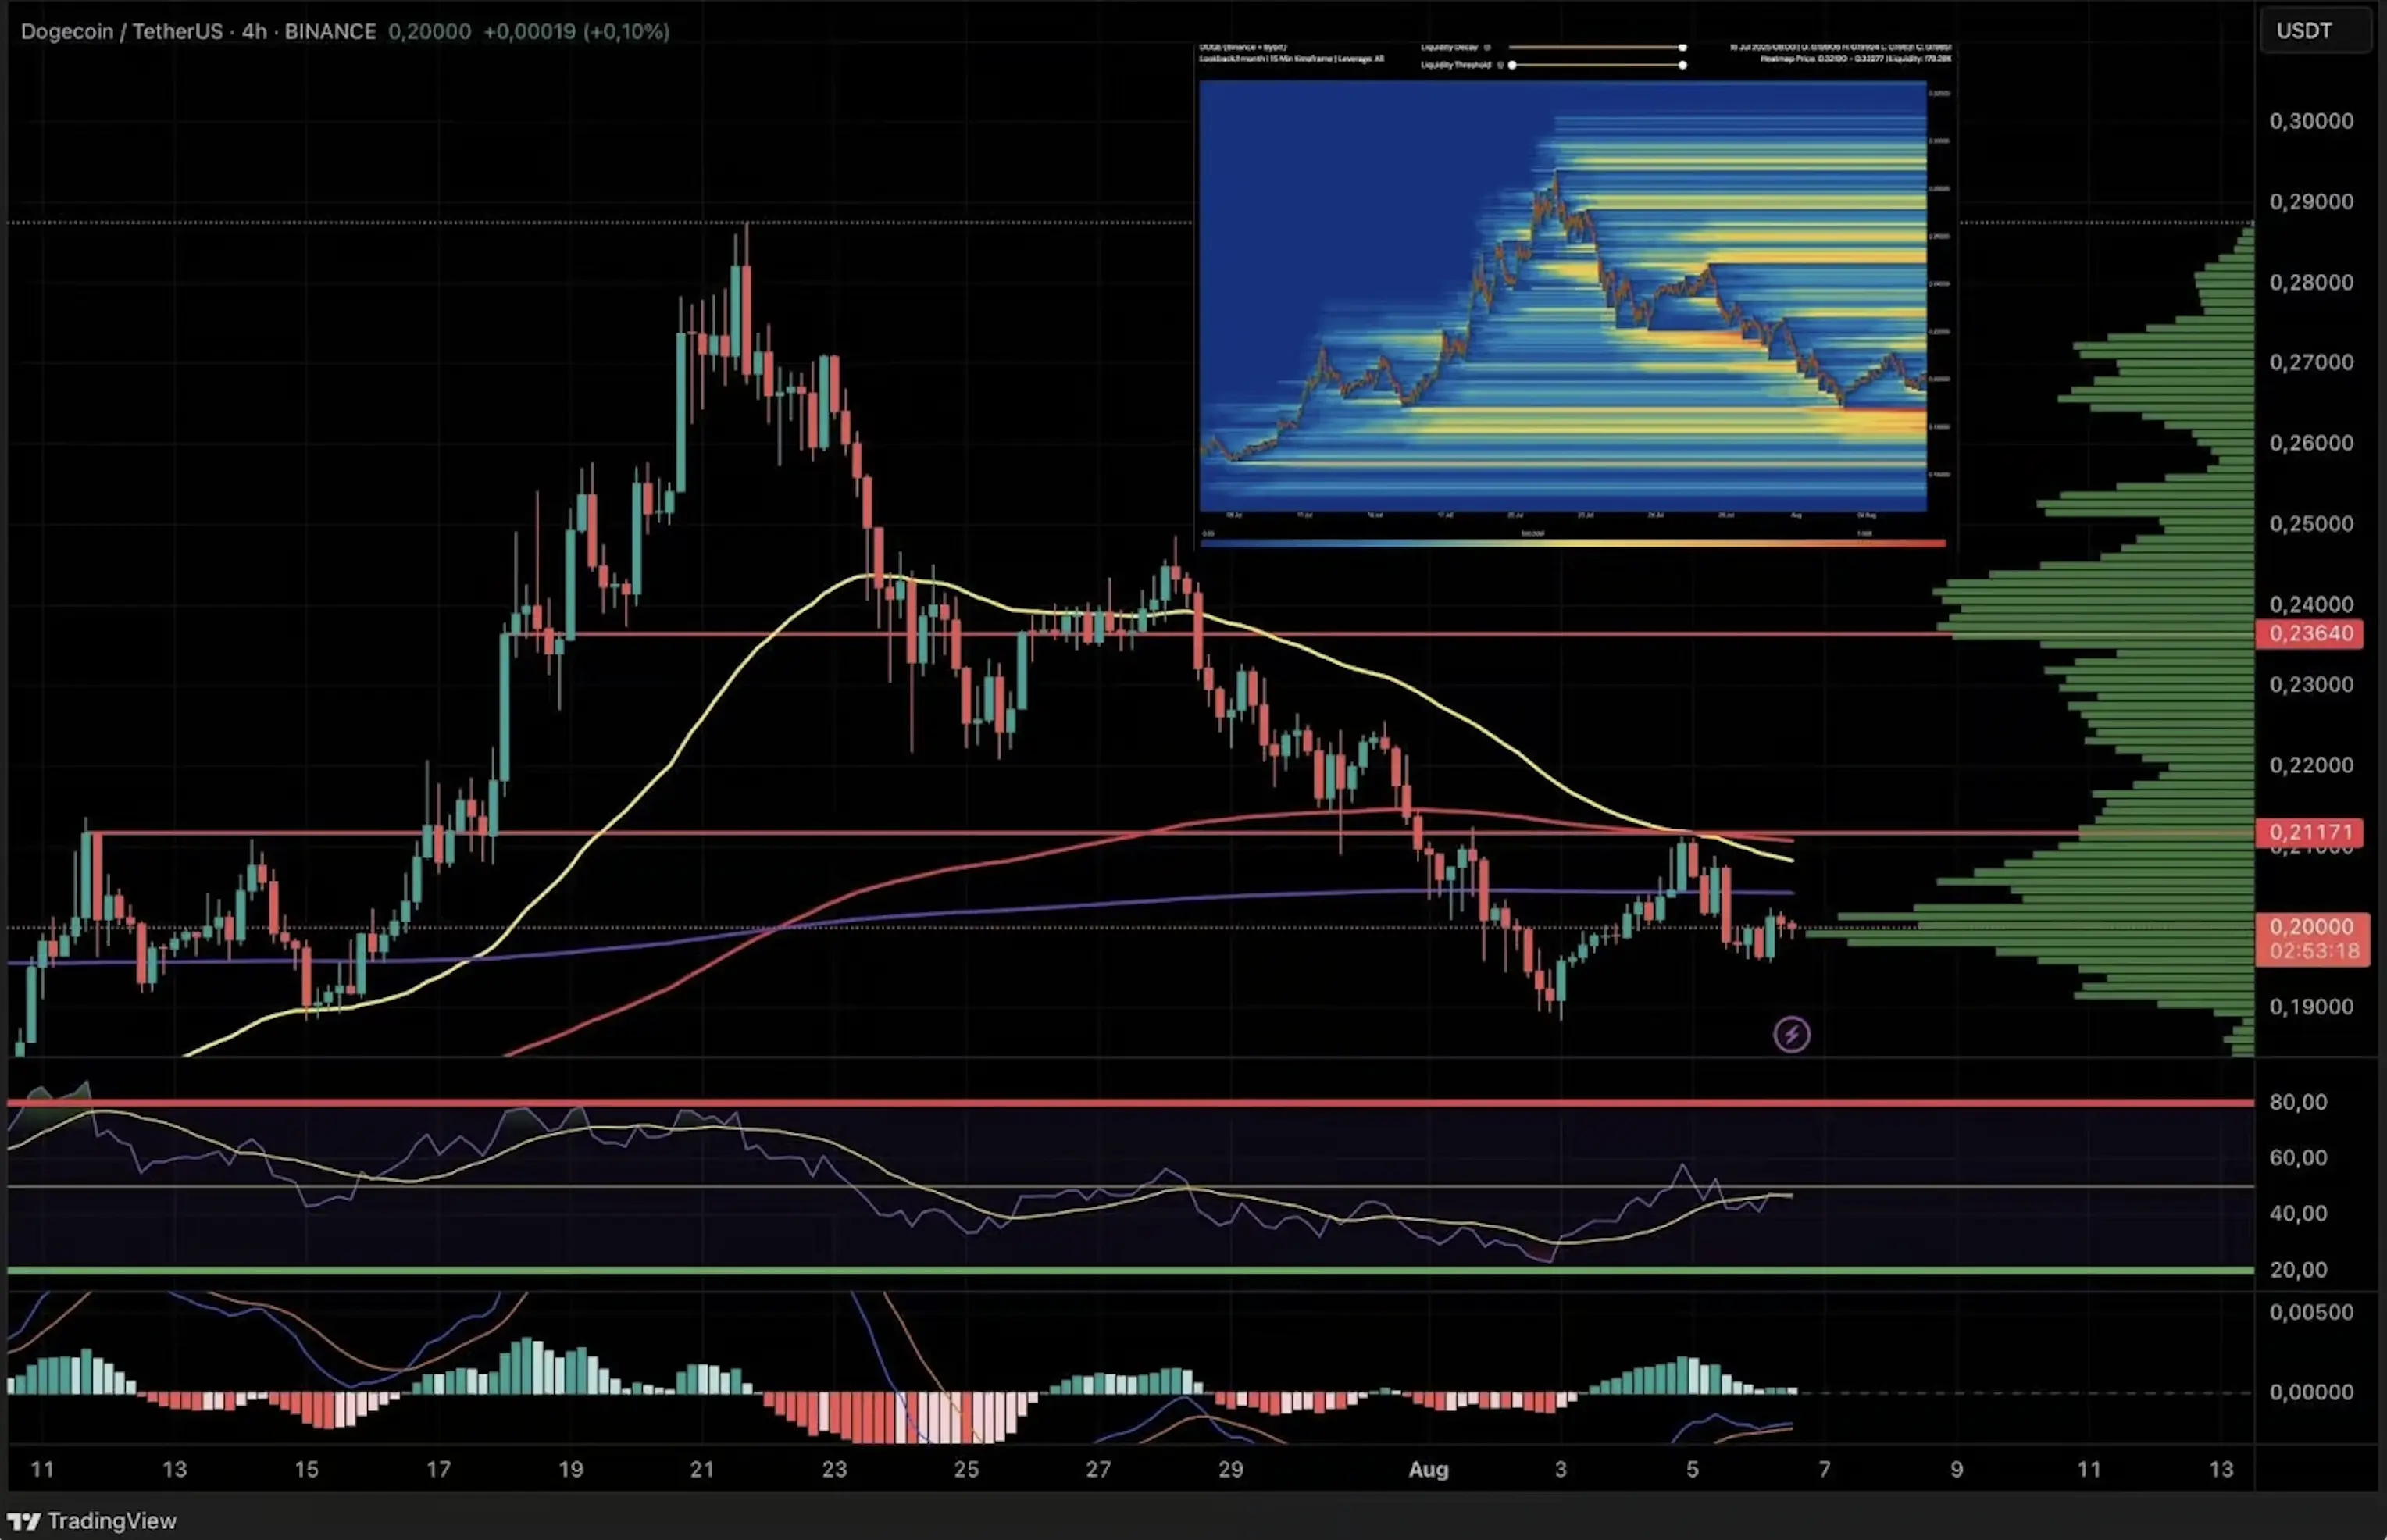
The 4-hour chart paints a picture of persistent sideways action, capped by a dense cluster of moving averages (50, 200, and 800 EMA) and a horizontal resistance at $0.21. This multi-layered barrier has repeatedly suppressed upward momentum, keeping DOGE in a neutral to slightly bearish posture in the short-term.
MACD readings reveal diminishing bullish momentum, with histogram peaks failing to reach new highs. This indicates growing caution among buyers. The liquidity heatmap shows a concentration of bids around $0.19, which may act as a short-term magnet if DOGE’s price falters.
As long as DOGE trades below the EMA cluster and remains capped by the $0.21 resistance, upside prospects are limited and risks of further downside persist. Only a convincing breakout—preferably backed by higher volume—would signal a potential reversal and renewed rally. Until then, the bias remains neutral with a slight bearish tilt, and traders should prepare for continued rangebound action or a test of lower support zones.
 DOGE 4-hour chart: Resistance cluster and liquidity targets
Conclusion: A Pivotal Week Ahead for DOGE
Dogecoin’s technical outlook hangs in the balance as it navigates major support near $0.20. A successful defense of this zone, coupled with market stabilization, could set the stage for a rebound toward $0.24. However, a break below $0.20 would put the next liquidity pool around $0.19 in play and could accelerate downside pressure. For now, caution remains warranted until a clear breakout or breakdown confirms the next trend
