

In the ever-evolving world of digital assets, trading is no longer just about reading candlestick patterns or tracking trend lines. For a new generation of sophisticated traders, volume analysis is emerging as a foundational tool to unlock the market’s “hidden layer”—the real story of capital flow, market maker activity, and liquidity. As crypto markets become more efficient yet remain volatile, the ability to interpret volume has become indispensable for those looking to trade with an edge.
What Is Volume Analysis? Why Should Every Trader Care?
Volume analysis (also known as volume-based trading) is the study of trading activity—how many units (coins, tokens, contracts) change hands over a given period—and its relationship to price movement. While traditional technical analysis focuses on price behavior alone, volume analysis adds a crucial extra dimension: it reveals the intensity, conviction, and potential sustainability of trends. Put simply, price movement without meaningful volume is often a mirage, while a surge in volume can herald the start of major moves—or warn of their exhaustion.
Why is this especially relevant for crypto? Unlike traditional equities, where information is more evenly distributed, the crypto market remains retail-driven, fragmented, and highly sensitive to news and rumors. Whales and institutional traders often move large sums, causing sudden price swings. In this environment, volume is often the first clue to what’s really happening behind the scenes—if you know how to read it.
How Volume Analysis Goes Beyond Classic Technical Tools
Most traders are familiar with candlestick patterns, support/resistance lines, moving averages, and oscillators like RSI or MACD. These are helpful, but they don’t answer a fundamental question: Is the move real, or is it just noise? Volume analysis, by contrast, shows the “fuel” behind every candle.
- Rising price, rising volume: Confirms strong trend, as new money flows in. Example: BTC breaks out above $50,000 with volume doubling its 20-day average—a textbook sign of real buyer interest.
- Rising price, falling volume: Classic warning of exhaustion; often precedes a reversal.
- Breakouts with low volume: More likely to fail. These “false breakouts” trap late buyers.
- Volume spikes at support/resistance: Often mark the presence of big players, liquidations, or key market turning points.
Key Principles of Volume Analysis: Decoding Market Behavior
1. Volume Confirms or Denies Trend Strength
True trends are supported by volume. When the price pushes up and volume expands, it signals conviction and participation. If volume dries up as the price rises (a pattern visible in many failed altcoin pumps), there’s little fuel for continuation.
2. Divergence: When Price and Volume Disagree
Volume divergence occurs when price moves in one direction but volume heads the other way. For instance, if ETH climbs for days but each day’s volume gets smaller, it can mean buyers are losing interest—a potential early warning for sharp corrections.
3. Volume Spikes as Signals of Accumulation or Distribution
Major surges in volume often precede trend changes. A huge volume bar after a prolonged sell-off may signal capitulation—a “washout” as the last sellers exit and smart money steps in. Conversely, a high-volume buying frenzy at new highs sometimes means the uptrend is peaking.
4. Liquidity and Slippage
Higher volumes mean higher liquidity, making it easier to execute large orders without slippage. For institutional traders or whales, volume is an essential metric in deciding when and where to enter or exit positions. On illiquid coins, even small orders can move price wildly, increasing risk.
Volume Analysis Tools: What Professional Traders Use
To fully exploit volume, advanced platforms offer a suite of visualization and analytical tools. Here’s a breakdown:
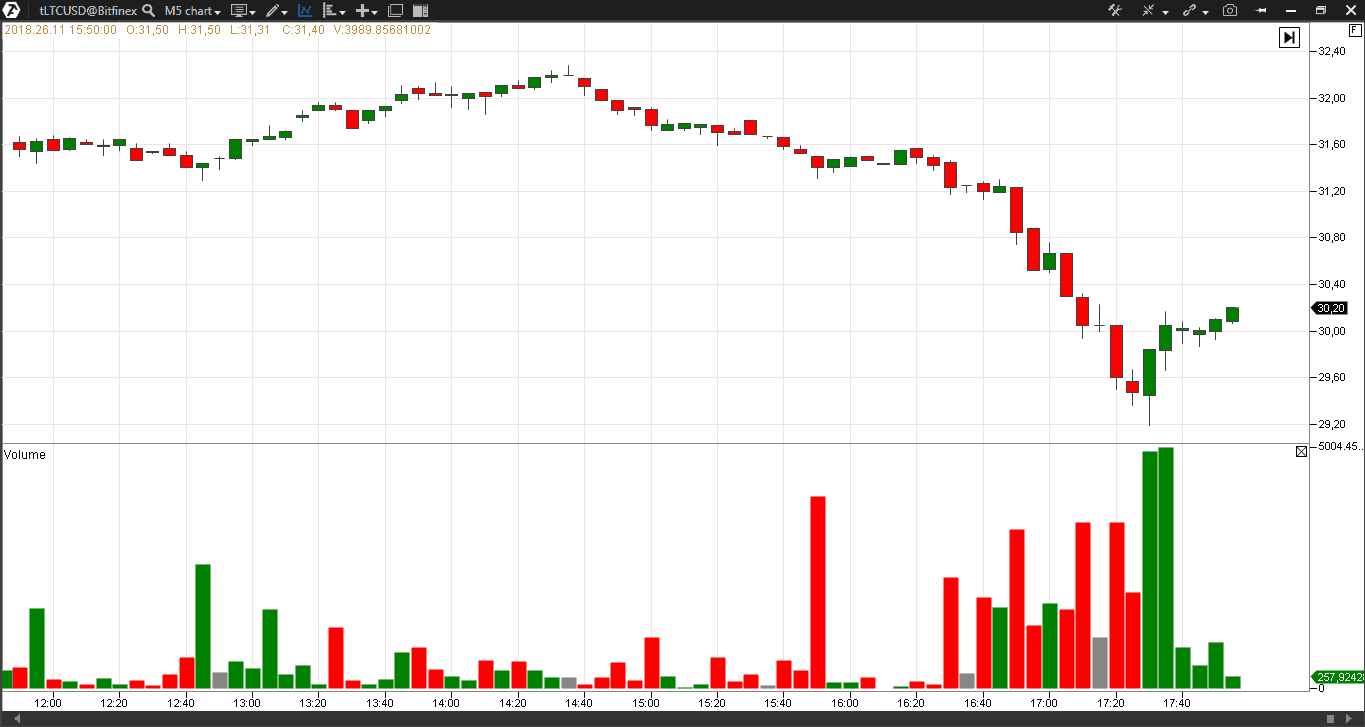
1. Vertical Volume (Standard Volume Bars)
The classic histogram under the price chart. Each bar shows total traded volume for a time period (minute, hour, day, etc.). This is the starting point for most traders.
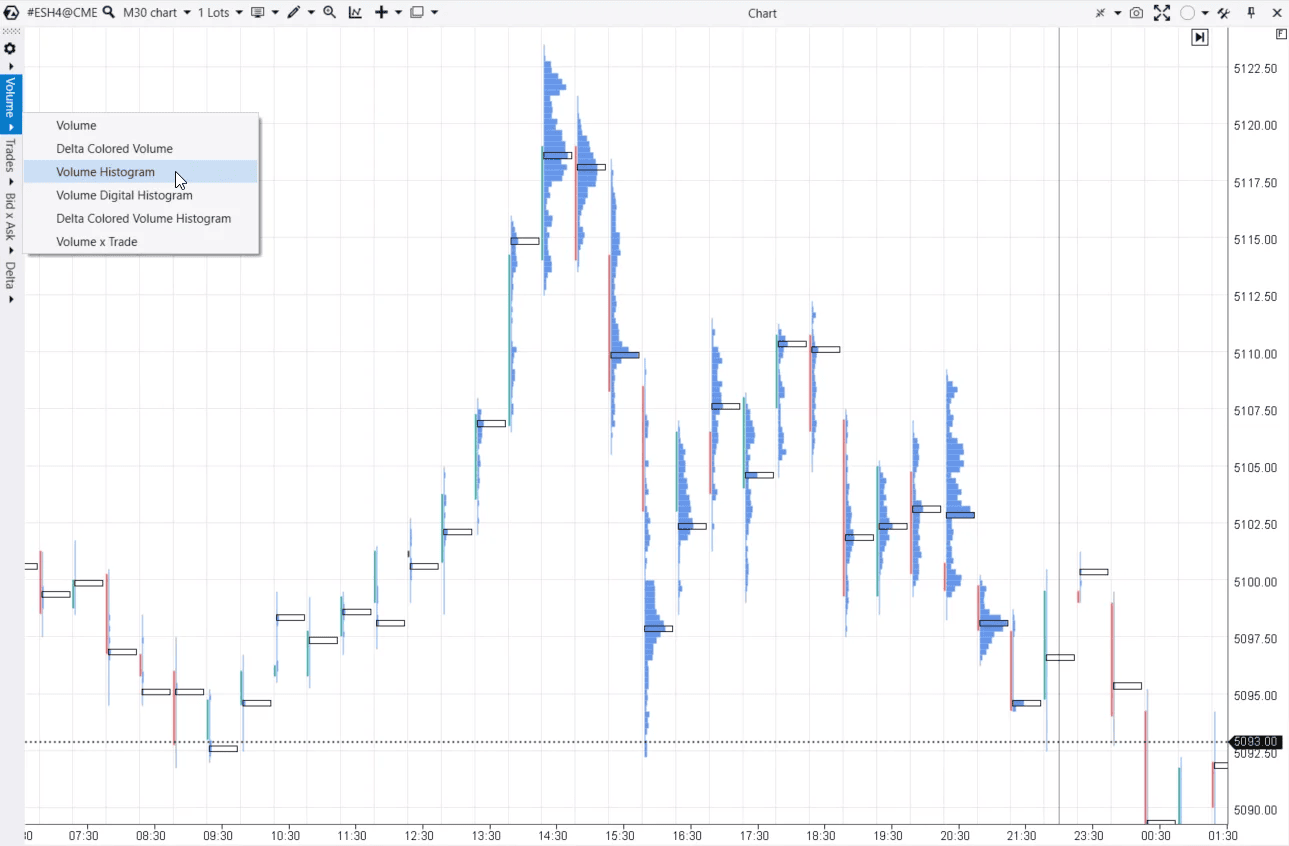
2. Horizontal Volume (Volume Profile / Market Profile)
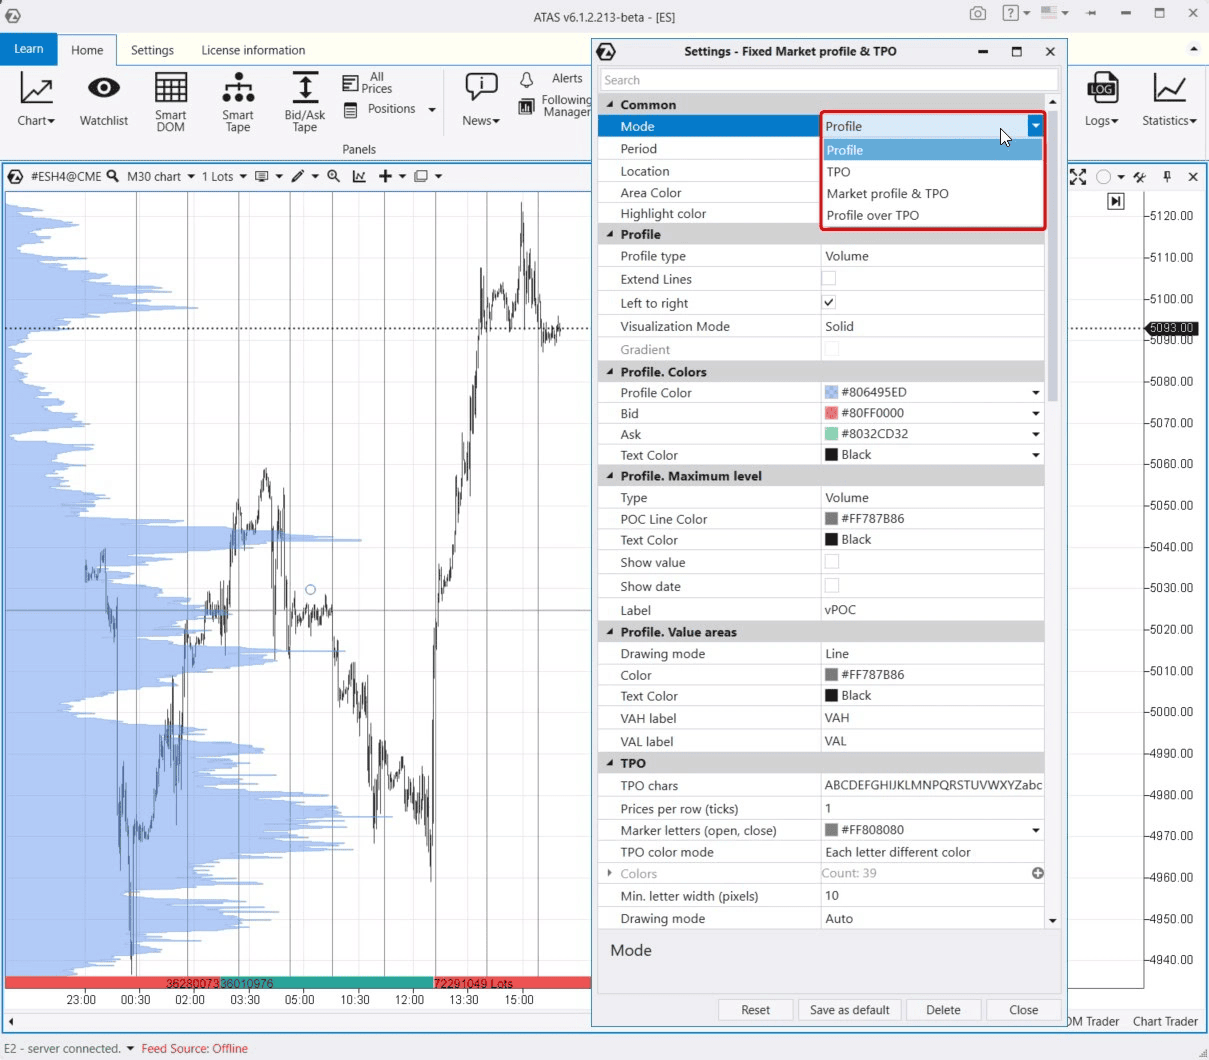
Example of displaying horizontal volumes. Data: ATAS.
Unlike vertical volume, this tool shows how much was traded at each price level (not just by time). The “Point of Control” (PoC) identifies the price level with the highest traded volume—a powerful magnet for price, often acting as support or resistance. Platforms like TradingView and ATAS make this analysis accessible even for beginners.
 Horizontal volume: spot institutional activity at key price levels. Источник: ATAS.
3. Cluster Analysis (Footprint Charts)
Footprint charts break down each candle to show exactly how much buying/selling occurred at every price within that interval. They expose hidden battles between bulls and bears, highlighting moments when large players (whales) step in with market orders. Footprint analysis is essential for scalpers and advanced day traders.
Example of displaying candle volumes. Data: ATAS.
4. Delta Analysis
The delta indicator measures the difference between aggressive buyers (market buys) and sellers (market sells). Positive delta means buyers are dominating; negative delta shows sellers have the upper hand. Sudden shifts in delta often signal that the balance of power is changing—a precursor to breakouts or reversals.
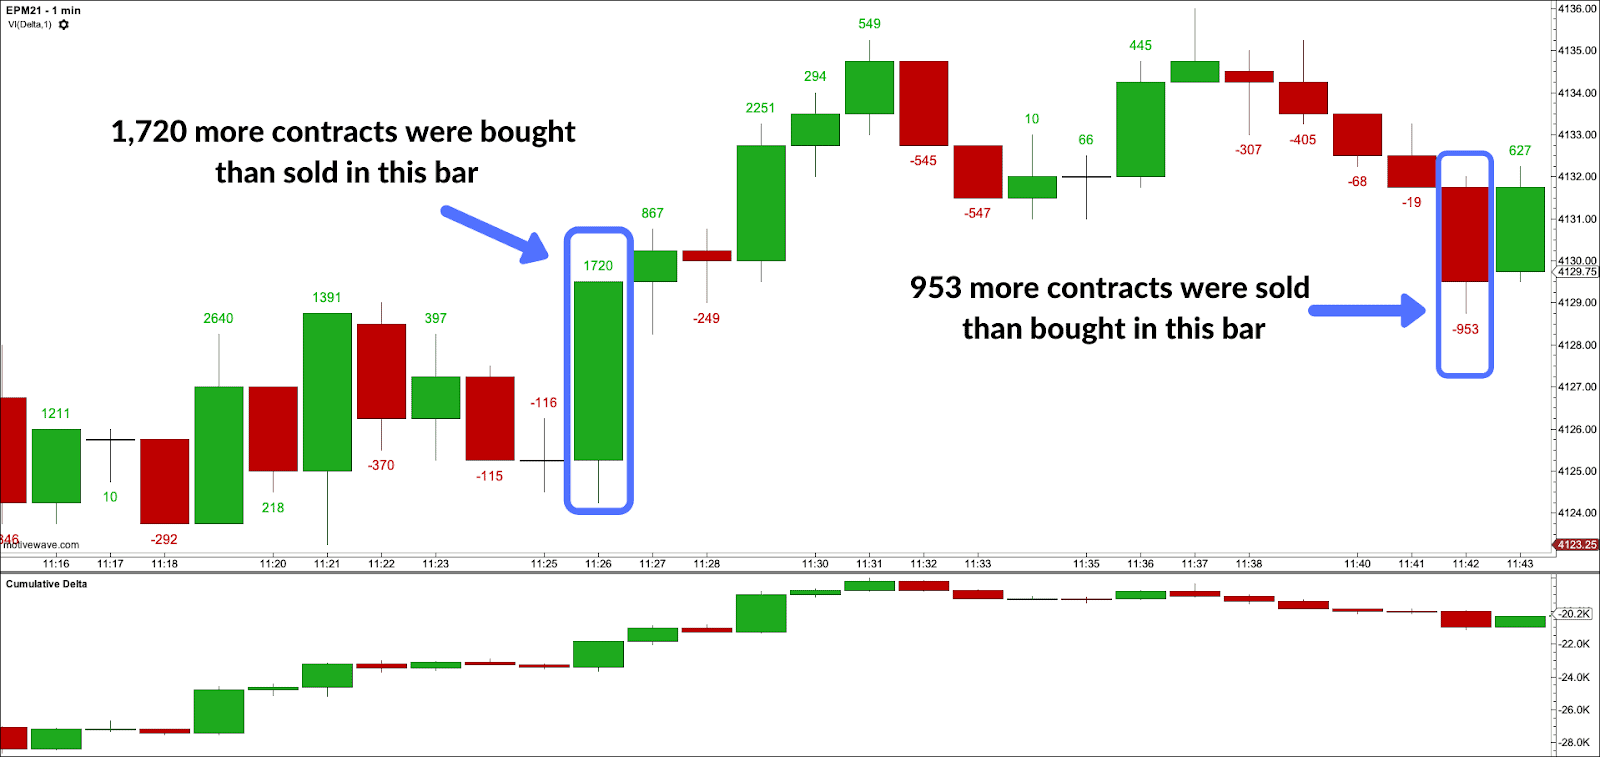
Пример отображения дельты. Данные: JumpTrading.
5. Order Flow Tools
Modern platforms allow traders to track live order flow—showing real-time executions, bid/ask liquidity, and large block trades. This gives insight into who is really controlling the market, not just who is posting “spoof” orders in the order book.
Practical Volume Patterns: What to Watch For
- Breakout Confirmation: Price breaks a key resistance zone on above-average volume, then pulls back with low volume before resuming upward. This is a classic bullish continuation.
- Climax Reversal: Explosive spike in both price and volume at the end of a trend, followed by a reversal. Often seen at major market tops or bottoms.
- Price Advances Without Volume: Price rises, but volume declines. High probability of a failed move or “bull trap.”
- Bearish Absorption: Sellers hit the market with large sell orders, but price doesn’t fall significantly and volume soars. This can mean large buyers are absorbing the selling pressure—often a sign of impending reversal upward.
Volume-Based Indicators and Their Crypto Applications
On-Balance Volume (OBV)
OBV sums volume on up days and subtracts volume on down days, tracking cumulative buying and selling pressure. Divergence between OBV and price often hints at trend exhaustion or a looming breakout.
Volume-Weighted Average Price (VWAP)
VWAP gives the average price weighted by volume over a specific session. Institutional traders use VWAP to gauge fair value for large orders. In crypto, VWAP is particularly popular for intraday strategies—acting as dynamic support/resistance.
Volume Spread Analysis (VSA)
VSA studies the relationship between candle size (spread), closing price, and volume. For example, a wide candle with high volume closing near the top suggests strong demand. By contrast, a wide candle with high volume closing near the bottom may signal distribution or smart money selling.
Types of Volume Analysis: Comparing Methods
Vertical vs. Horizontal Volume
Vertical volume is best for spotting momentum shifts within time periods, while horizontal volume reveals where the “battle lines” are drawn at different price levels.
Order Flow and Footprint Analysis
Order flow goes granular—allowing scalpers and day traders to spot which side is aggressive at each price tick. This is especially useful in fast markets (like after major news), where every second counts.
Volume Delta and Trade Imbalances
By comparing buy/sell imbalances at critical levels, traders can identify where smart money is accumulating or distributing assets, allowing them to “ride the coattails” of larger participants.
Volume Analysis in Different Trading Styles
Scalping
Scalpers operate on the tightest timeframes (seconds to minutes). For them, volume analysis—especially cluster and delta tools—helps pinpoint micro-shifts in control, often predicting a 0.1–0.5% move before it hits the wider market.
Day Trading
Day traders use volume profile to identify high-probability zones for entries and exits, watching for confirmation on breakouts or signs of exhaustion after a run.
Swing Trading
Swing traders look at multi-day volume trends, confirmation on breakouts above resistance, and volume-based divergences to hold positions through larger moves.
Limitations of Volume Analysis (And How to Overcome Them)
- Data Quality: Not all exchanges report volume accurately; some inflate figures. Rely on top-tier exchanges and cross-check data where possible.
- Access to Advanced Tools: Full-featured volume analytics often require paid platforms (ATAS, TradingView Pro, Bookmap). While basic tools are free, deeper insights come with investment.
- Learning Curve: Properly interpreting volume (especially order flow and footprint data) requires study and hands-on practice. Many traders misinterpret early signals—use demo accounts to build skill.
- Forex Exception: True volume is not available on spot forex, but brokers provide tick volume (number of price changes)—still useful as a proxy for activity.
Step-by-Step Guide: Getting Started With Volume Analysis
- Select a Platform: Choose a charting tool with strong volume analytics. TradingView offers good starting features; ATAS and Bookmap provide advanced order flow visualization.
- Master the Basics: Start by overlaying vertical volume bars on your price chart. Study how volume surges and fades during key price moves.
- Experiment With Horizontal Volume: Learn to interpret volume profile charts. Note where PoC and high-volume nodes are and watch price reactions near these areas.
- Practice With Footprint and Delta: Use a demo account to analyze real-time cluster and delta signals. Record your trades and review which setups worked best.
- Integrate Into Your Trading Plan: Combine volume signals with technical analysis (e.g., wait for volume confirmation before acting on breakouts).
- Continuous Learning: Follow blogs and webinars by professional traders, join trading communities, and stay updated on new platform features and volume-based indicators.
Real-World Case Study: Crypto Volume Analysis in Action
Consider the 2023 Bitcoin rally. As BTC broke above $30,000 after months of consolidation, a spike in volume across leading exchanges confirmed institutional entry. On-chain data (Glassnode, CryptoQuant) showed whales accumulating. Order flow on Binance revealed large buy walls absorbing sellers. Traders who waited for both price and volume confirmation entered the move early—and avoided classic “bull traps” that had no volume behind them.
Frequently Asked Questions (FAQ)
How is volume analysis different from regular technical analysis? Technical analysis looks at price and patterns. Volume analysis examines the depth and conviction behind those moves—offering early clues about trend sustainability and reversals.
Can I use volume analysis on forex or low-liquidity coins? True volume isn’t available on spot forex, but tick volume is a good proxy. On low-liquidity coins, be extra cautious—small trades can cause misleading spikes.
Which indicators are best for beginners? Start with vertical volume and On-Balance Volume (OBV). Once comfortable, explore volume profile and footprint charts.
Is volume analysis effective for crypto swing trading? Absolutely—volume confirms the strength of breakouts, identifies accumulation/distribution zones, and spots reversals before they become obvious on price alone.
How long to become proficient? With consistent practice on a demo account and continuous learning, most traders develop real volume skills in 2–4 months.