

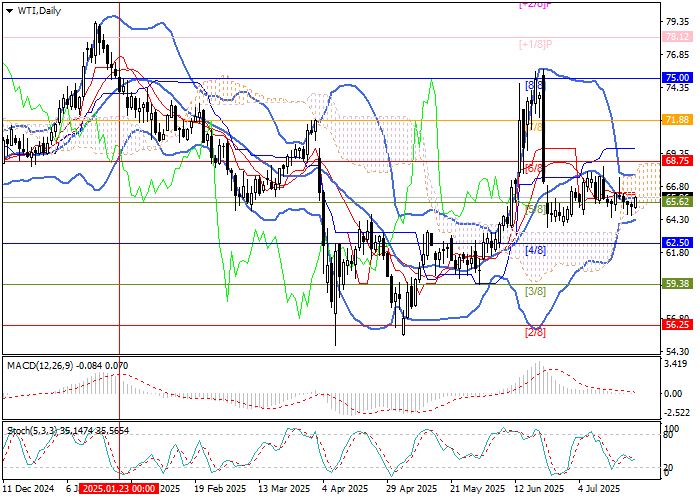
WTI Crude Oil prices are currently consolidating near $65.62 (Murray level [5/8]), reflecting a landscape of conflicting factors that are keeping investor sentiment muted. The dominant theme remains trade policy uncertainty. After news of a compromise on import tariffs between the U.S. and Japan, market participants are anticipating final trade agreements with both Chinese and European authorities in the near future. Failure to reach such deals could intensify pressure on the global economy, ultimately weighing on energy demand.
The recent downward move in oil prices is being partially offset by inventory data. The American Petroleum Institute (API) reported a drawdown of –0.577M barrels, while the U.S. Energy Information Administration (EIA) reported a more significant decrease of –3.169M barrels, far exceeding market expectations of a –1.4M barrel drop. Gasoline inventories fell by –1.738M barrels, indicating robust consumption in the world’s largest economy. Additionally, U.S. officials have stated that further sanctions against Russia’s energy sector are under consideration, targeting a swift resolution to the ongoing Russia-Ukraine conflict, which could in turn disrupt global supply chains.
Against this backdrop, the outlook for the oil market remains uncertain and highly dependent on how the U.S. resolves its trade disputes with key partners.
Support and Resistance Levels
WTI is trading close to $65.62 (Murray level [5/8]). A break below this mark opens the door to lower targets at $62.50 (Murray [4/8]), $59.38 (Murray [3/8]), and $56.25 (Murray [2/8]). Conversely, a rally above $68.75 (Murray [6/8]) would set up the market for moves toward $71.88 (Murray [7/8]) and $75.00 (Murray [8/8]). The weekly chart maintains a downward bias, suggesting that further price weakness remains a real possibility.
Technical indicators are mixed: Bollinger Bands and Stochastic remain flat, while the MACD histogram sits near the zero line, with low volume—signaling indecision.
- Resistance: $68.75, $71.88, $75.00
- Support: $62.50, $59.38, $56.25
Trading Scenarios
Short positions may be considered from $64.80, targeting $62.50 and $59.38, with a stop-loss at $66.70. (Time horizon: 5–7 days)
Long positions could be opened above $68.75, aiming for $71.88 and $75.00, with a stop-loss at $66.30.
Weekly Chart: Key Trading Plan
- SELL STOP: Entry $64.80 | Take Profit $62.50, $59.38 | Stop Loss $66.70
- BUY STOP: Entry $68.75 | Take Profit $71.88, $75.00 | Stop Loss $66.30
- Key Levels: $56.25, $59.38, $62.50, $68.75, $71.88, $75.00
 WTI Oil: trading near support