

Late last week, US President Donald Trump announced plans to introduce 10.0% import tariffs on eight European countries—Germany, Sweden, France, the Netherlands, Denmark, Norway, the United Kingdom, and Finland—warning that if these states do not support his intention to “acquire” Greenland, the rate would rise to 25.0% from June 1. This prospect is weighing on equity markets: shares of industrial and export-oriented companies have declined by an average of 1.0–2.0%, while certain sectors tied to machinery and technology have fallen by 3.0–4.0%. In response, France proposed a tough financial countermeasure against the US, including the potential blocking of US exports worth around €93.0 billion. For now, support for this initiative is largely limited to the German government, so the probability of implementation remains moderate. In addition, the EU has a potential pressure lever via sales of US debt assets—around $8.0 trillion held by European countries and central banks—but a large-scale sell-off could also create problems for European financial systems, so this option remains largely theoretical at this stage.
In the domestic bond market, demand for debt securities has increased somewhat, triggering a pullback in yields across most maturities. On Monday, France held auctions for short-term bills: three- and six-month bills were placed at yields of 2.019% and 2.048%, respectively, only slightly below the previous auction levels of 2.026% and 2.068%. The one-year bill yield came in at 2.085%, marginally below 2.098% at the prior auction. As for longer-dated instruments, the 10-year yield adjusted to 3.526% from 3.529% at the end of last week, the 20-year yield moved to 4.143% from 4.134%, and the 30-year yield edged to 4.448% from 4.442%.
Top gainers within the index include Renault SA (+2.25%), Euronext NV (+2.21%), STMicroelectronics NV (+1.51%), TotalEnergies SE (+1.41%), and Pernod Ricard SA (+1.09%).
Notable decliners include Capgemini SE (–2.77%), Kering SA (–2.60%), LVMH Moet Hennessy Louis Vuitton SE (–2.20%), Eurofins Scientific SE (–2.17%), and Veolia Environnement VE SA (–1.87%).
Support and resistance levels
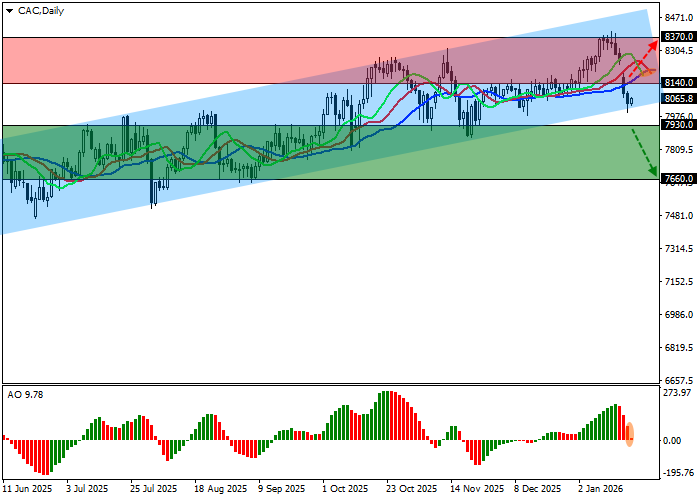
On the daily chart, the index continues a local correction, attempting to pull away from the resistance line of an ascending channel with dynamic boundaries at 8500.0–8040.0.
Technical indicators maintain a sell signal: the fast EMAs on the Alligator indicator are widening their range, while the AO histogram, slightly below the zero line, is forming corrective bars.
Support levels: 7930.0, 7660.0.
Resistance levels: 8140.0, 8370.0.
Trading scenarios and CAC 40 outlook
If the decline continues and price consolidates below the 7930.0 support level, sell positions may be considered with a target at 7660.0. Stop-loss: 8050.0. Time horizon: 7 days or longer.
If the market reverses and the rally resumes with a break and consolidation above 8140.0, buy positions may be considered with a target at 8370.0 and a stop-loss at 8030.0.
Scenario
| Timeframe | Weekly |
| Recommendation | SELL STOP |
| Entry point | 7930.0 |
| Take Profit | 7660.0 |
| Stop Loss | 8050.0 |
| Key levels | 7660.0, 7930.0, 8140.0, 8370.0 |
Alternative scenario
| Recommendation | BUY STOP |
| Entry point | 8140.0 |
| Take Profit | 8370.0 |
| Stop Loss | 8030.0 |
| Key levels | 7660.0, 7930.0, 8140.0, 8370.0 |
