

Last Thursday, the U.S. released August inflation data along with a Labor Department report highlighting serious hiring issues caused by tariff restrictions and high interest rates. The Consumer Price Index rose again from 2.7% to 2.9%, confirming the Federal Reserve’s concerns that elevated tariffs initiated by the White House are still contributing to inflationary pressure. On the other hand, this trend remains predictable and manageable, reducing the need for aggressive monetary tightening. Meanwhile, labor market figures since March of last year were revised sharply lower, while jobless claims continue to rise, signaling hiring challenges linked to business uncertainty over monetary policy. In this context, the Fed is likely to cut rates by 25 basis points
Against this backdrop, investors have once again turned to bonds, temporarily pushing yields lower: the 10-year Treasury yield dropped to 4.077% from 4.276% a week earlier, while the 20-year yield slipped to 4.649% from 4.854%.
Leading gainers in the index include Microsoft Corp. (+1.77%), Apple Inc. (+1.76%), and Walmart Inc. (+0.82%).
Top decliners were Merck & Company Inc. (–2.75%), Sherwin-Williams Co. (–2.33%), and Amgen Inc. (–2.24%).
Support and Resistance Levels
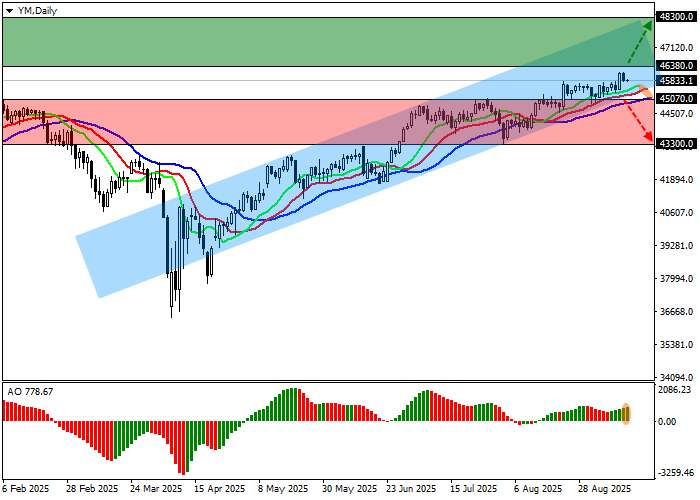
On the daily chart, the index continues a corrective move after a successful breakout of the yearly high at 45,800.0.
Technical indicators remain steadily bullish, signaling the potential continuation of the uptrend: the EMA range of the Alligator indicator stays narrow, while the AO histogram forms new corrective bars just below the zero line.
Support levels: 45,070.0, 43,300.0.
Resistance levels: 46,380.0, 48,300.0.
Trading Scenarios and Dow Jones Forecast
If growth continues and the price consolidates above resistance at 46,380.0, buy positions become relevant with a target of 48,300.0 and a stop-loss at 45,900.0. Implementation period: 7 days or more.
If the trend reverses and the price consolidates below support at 45,070.0, sell positions become relevant with a target of 43,300.0. Stop-loss — 45,500.0.
Scenario
| Timeframe | Weekly |
| Recommendation | BUY STOP |
| Entry Point | 46,380.0 |
| Take Profit | 48,300.0 |
| Stop Loss | 45,900.0 |
| Key Levels | 43,300.0, 45,070.0, 46,380.0, 48,300.0 |
Alternative Scenario
| Recommendation | SELL STOP |
| Entry Point | 45,070.0 |
| Take Profit | 43,300.0 |
| Stop Loss | 45,500.0 |
| Key Levels | 43,300.0, 45,070.0, 46,380.0, 48,300.0 |
