

Metal prices remain under significant pressure amid the strengthening US dollar, supported by growing signs that the Federal Reserve may maintain its current monetary policy for an extended period. The escalation of the US-Iran conflict, during which major damage was inflicted on energy infrastructure, has sharply increased the cost of hydrocarbons and reinforced the risk of faster global consumer inflation, which in turn could lead leading central banks toward a more hawkish stance. In particular, Qatar has reportedly lost 17.0% of its total liquefied natural gas production capacity, with recovery expected to take between three and five years. On Wednesday, Federal Reserve officials left the key interest rate unchanged in the 3.50–3.75% range while raising their inflation forecast for this year from 2.4% to 2.7%.
Fed Chair Jerome Powell said that higher energy prices caused by the US-Iran confrontation would be reflected in economic indicators, although there is still insufficient data to assess the scale and duration of the potential impact. In February, before the outbreak of hostilities, the consumer price index stood at 2.4%, the core reading was 2.5%, while producer price inflation came in at 3.4% and 3.9%, respectively. At the same time, the labor market remains stable despite some signs of cooling, which supports the Fed’s wait-and-see stance. The dot plot also shows that most policymakers now expect only one rate cut in 2026 instead of two as previously projected, while some officials favor leaving monetary policy unchanged until early next year.
Support and resistance levels
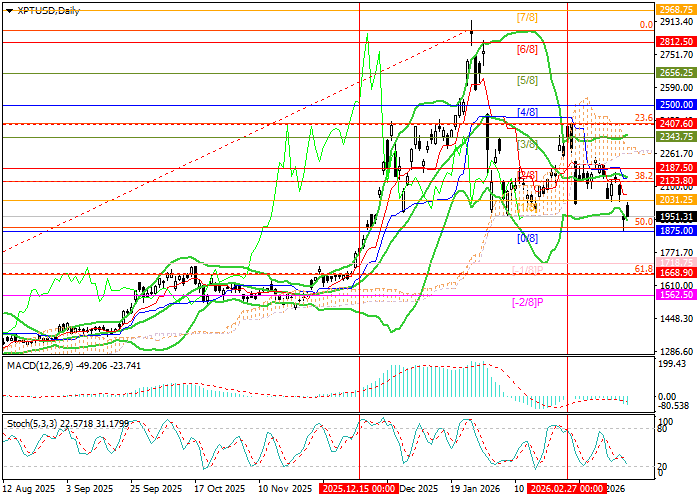
The instrument is testing the 1875.00 mark (Murray [4/8] level, 50.0% Fibonacci retracement). A breakout below this level would open the way toward 1668.90 (61.8% Fibonacci retracement) and 1562.50 (Murray [–2/8] level). However, if the price consolidates above the 2123.80–2187.50 support area (38.2% Fibonacci retracement, Murray [2/8] level, the middle Bollinger Band), growth may resume toward the targets at 2500.00 (Murray [4/8] level), 2812.50 (Murray [6/8] level), and 2968.75 (Murray [7/8] level).
Technical indicators are giving mixed signals: Bollinger Bands are horizontal, the MACD histogram is increasing in the negative zone, and Stochastic is moving downward but approaching oversold territory, which does not rule out a reversal.
Resistance levels: 2187.50, 2500.00, 2812.50, 2968.75.
Support levels: 1875.00, 1668.90, 1562.50.
Trading scenarios and XPT/USD forecast
Short positions can be opened below 1875.00 with targets at 1668.90 and 1562.50 and a stop-loss at 2060.00. Implementation period: 5–7 days.
Long positions can be opened above 2187.50 with targets at 2812.50 and 2968.75 and a stop-loss at 2025.00.
Scenario
| Timeframe | Weekly |
| Recommendation | SELL STOP |
| Entry point | 1874.95 |
| Take Profit | 1668.90, 1562.50 |
| Stop Loss | 2060.00 |
| Key levels | 1562.50, 1668.90, 1875.00, 2187.50, 2500.00, 2812.50, 2968.75 |
Alternative scenario
| Recommendation | BUY STOP |
| Entry point | 2187.55 |
| Take Profit | 2812.50, 2968.75 |
| Stop Loss | 2025.00 |
| Key levels | 1562.50, 1668.90, 1875.00, 2187.50, 2500.00, 2812.50, 2968.75 |
