

The RBA minutes showed that six board members backed a 25-basis-point increase to 4.85%, the fifth hike this year. They saw upside risks to inflation and questioned whether previous increases had tightened financial conditions enough. Three members favoured keeping the rate at 4.60% to assess the effects of earlier hikes as unemployment reached 4.7% in September and housing prices declined. Reuters reported that markets had priced in about 22 basis points of easing by the end of 2027. Weak household sentiment had already added to pressure on the Australian dollar.
In the US, stronger-than-expected inflation and resilient hiring kept a December Federal Reserve rate increase in view. The October CPI rose 0.4% month on month against a forecast of 0.3%, while core CPI rose 0.3% against an expected 0.2%. Nonfarm payrolls increased by 165,000 and unemployment edged down to 4.1%. By November 17, however, the market-implied probability of a 50-basis-point December hike had fallen to 2.6% from as high as 14.5% the previous Thursday, according to CME FedWatch figures cited by Reuters.
Expectations that Australian rates have peaked, while US rates could still rise, leave AUD/USD vulnerable to further declines.
Support and resistance levels
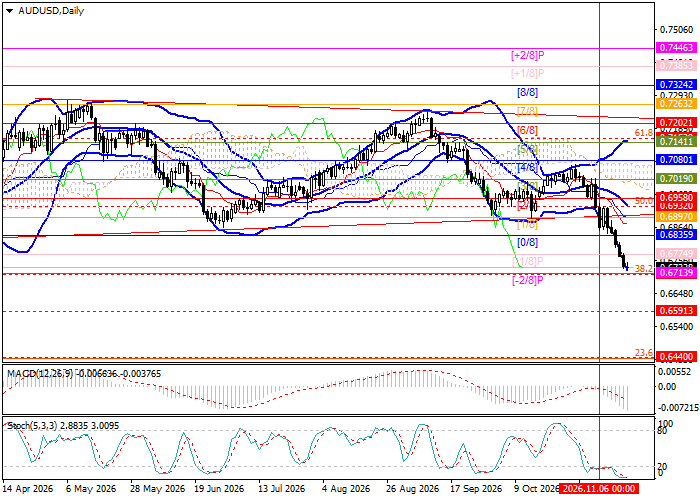
AUD/USD is approaching 0.6713, the 38.2% Fibonacci retracement and the Murrey Math [–2/8] level. A break below it could put 0.6591 (weekly Murrey Math [2/8]) and 0.6440 (23.6% Fibonacci retracement) in view. A sustained move above 0.6958, the middle Bollinger Band and the Murrey Math [2/8] level, could open the way to 0.7141 and 0.7324. The first target aligns with the upper Bollinger Band, the 61.8% Fibonacci retracement and the Murrey Math [5/8] level, while 0.7324 corresponds to the [8/8] level.
The Bollinger Bands are turning lower and the MACD histogram is expanding in negative territory. The Stochastic oscillator is oversold, leaving room for a short-term rebound.
Resistance levels: 0.6958, 0.7141, 0.7324.
Support levels: 0.6713, 0.6591, 0.6440.
Trading scenarios and AUD/USD forecast
A break below 0.6713 would activate the short scenario, with targets at 0.6591 and 0.6440 and a stop-loss at 0.6790. Estimated timeframe: 5–7 days.
A move above 0.6958 would activate the long scenario, with targets at 0.7141 and 0.7324 and a stop-loss at 0.6840.
Scenario
| Timeframe | Weekly |
| Recommendation | SELL STOP |
| Entry point | 0.6713 |
| Take Profit | 0.6591, 0.6440 |
| Stop Loss | 0.6790 |
| Key levels | 0.6440, 0.6591, 0.6713, 0.6958, 0.7141, 0.7324 |
Alternative scenario
| Recommendation | BUY STOP |
| Entry point | 0.6958 |
| Take Profit | 0.7141, 0.7324 |
| Stop Loss | 0.6840 |
| Key levels | 0.6440, 0.6591, 0.6713, 0.6958, 0.7141, 0.7324 |
