
Statistics Canada reported that annual inflation held at 3.1% in October, below the 3.2% forecast. Gasoline prices rose 30.9% year on year, transportation costs increased 8.9% and grocery prices climbed 2.0%. The Bank of Canada’s preferred core measures were closer to its 2% target. CPI-median held at 2.0%, while CPI-trim eased from 1.9% to 1.8%. After the release, the market-implied probability of a December 9 rate hike fell from 54% to 38%, Reuters reported. The repricing follows JPMorgan’s earlier assessment that markets were pricing in more tightening than its economists expected.
In the US, October consumer prices rose 0.4% month on month against a forecast of 0.3%, while core CPI rose 0.3% against an expected 0.2%. Nonfarm payrolls increased by 165,000 and unemployment stood at 4.1%. Cleveland Fed President Beth Hammack reiterated her preference for gradual rate increases. On November 17, CME FedWatch put the probability of a quarter-point December hike at above 95%, according to The Wall Street Journal.
The contrast in rate expectations continues to favour the US dollar. Canada and China also announced an expansion of their trade arrangement on November 17. China will provide additional tariff relief on roughly C$400 million of Canadian exports, including frozen pork and seafood. Canada will extend and broaden tariff exemptions for certain Chinese steel and aluminium products through the end of 2028.
Support and resistance levels
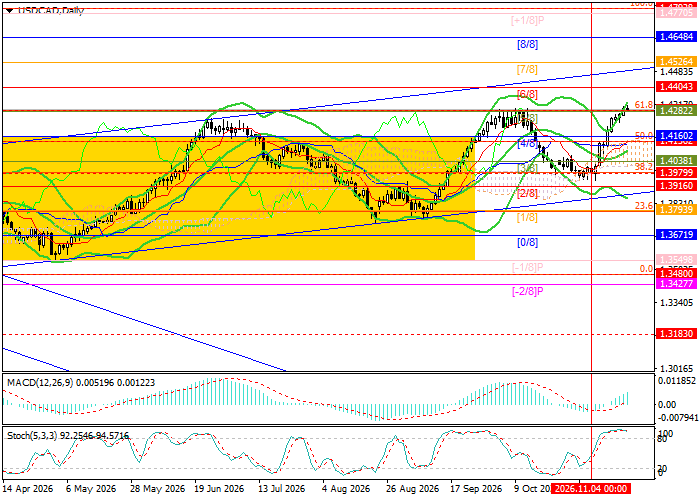
USD/CAD remains in an ascending channel and is testing whether it can hold above 1.4282, where the 61.8% Fibonacci retracement meets the Murrey Math [5/8] level. A sustained break higher would bring 1.4526 (Murrey Math [7/8] and the upper channel boundary) and 1.4648 (Murrey Math [8/8]) into view. A break below the 1.4136–1.4160 support zone, which includes the Murrey Math [4/8] level, the 50% Fibonacci retracement and the middle Bollinger Band, could expose 1.3916 (Murrey Math [2/8] and the lower Bollinger Band) and 1.3671 (Murrey Math [0/8]).
The Bollinger Bands are turning higher and the MACD histogram has moved into positive territory. The Stochastic oscillator has flattened in overbought territory, leaving room for a near-term pullback.
Resistance levels: 1.4282, 1.4526, 1.4648.
Support levels: 1.4136, 1.3916, 1.3671.
Trading scenarios and USD/CAD forecast
The long scenario uses an entry at 1.4320, with targets at 1.4526 and 1.4648 and a stop-loss at 1.4240. Estimated timeframe: 5–7 days.
A break below 1.4136 would trigger the short scenario, with targets at 1.3916 and 1.3671 and a stop-loss at 1.4210.
Scenario
| Timeframe | Weekly |
| Recommendation | BUY STOP |
| Entry point | 1.4320 |
| Take Profit | 1.4526, 1.4648 |
| Stop Loss | 1.4240 |
| Key levels | 1.3671, 1.3916, 1.4136, 1.4282, 1.4526, 1.4648 |
Alternative scenario
| Recommendation | SELL STOP |
| Entry point | 1.4136 |
| Take Profit | 1.3916, 1.3671 |
| Stop Loss | 1.4210 |
| Key levels | 1.3671, 1.3916, 1.4136, 1.4282, 1.4526, 1.4648 |
