

Technical indicators do not provide a unified signal. The Bollinger Bands are shifting into horizontal movement, the MACD histogram remains stable in positive territory, while the Stochastic Oscillator is turning upward from the oversold zone. It is also worth noting that the current position of the trading instrument on the weekly chart resembles the formation of a Flag pattern within the long-term downtrend. A breakout above 2000.00, the middle Bollinger Band on the weekly chart, could signal a possible reversal of the trend to the upside.
Support and Resistance Levels
Resistance levels: 2000.00, 2125.00, 2500.00.
Support levels: 1750.00, 1500.00, 1375.00.
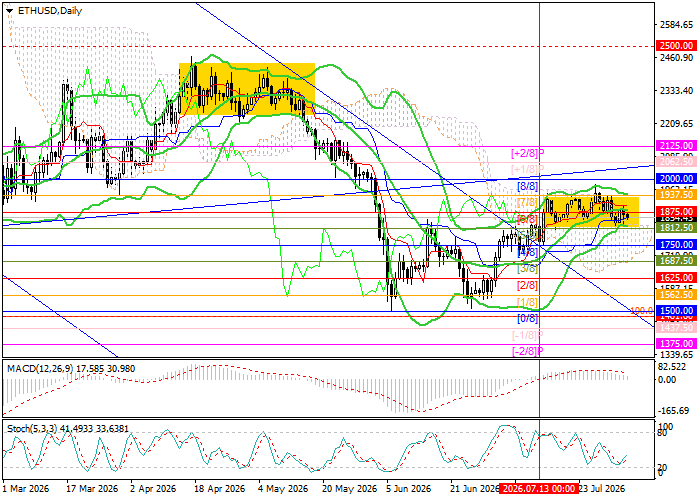
ETH/USD Trading Scenarios and Price Forecast
Short positions may be opened below 1750.00 with targets at 1500.00 and 1375.00 and a stop-loss at 1900.00. Time horizon: 5–7 days.
Long positions may be opened above 2000.00 with targets at 2125.00 and 2500.00 and a stop-loss at 1910.00.
Scenario
| Timeframe | Weekly |
| Recommendation | SELL STOP |
| Entry Point | 1750.00 |
| Take Profit | 1500.00, 1375.00 |
| Stop Loss | 1900.00 |
| Key Levels | 1375.00, 1500.00, 1750.00, 2000.00, 2125.00, 2500.00 |
Alternative Scenario
| Recommendation | BUY STOP |
| Entry Point | 2000.00 |
| Take Profit | 2125.00, 2500.00 |
| Stop Loss | 1910.00 |
| Key Levels | 1375.00, 1500.00, 1750.00, 2000.00, 2125.00, 2500.00 |
