

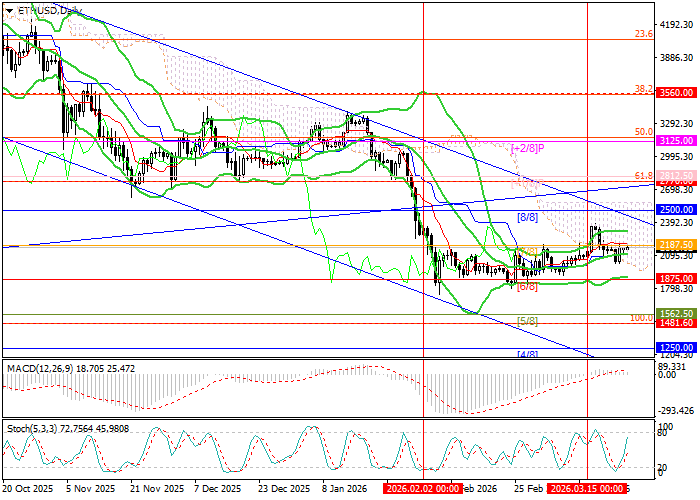
Technical indicators are not giving a unified signal, confirming the uncertainty that still dominates the market. Bollinger Bands have shifted into horizontal movement, the MACD histogram remains near the zero line with low volume, while Stochastic is moving upward but is already close to the overbought zone, which does not rule out a near-term reversal. It is also worth noting that on the weekly chart Bollinger Bands remain directed downward and, together with the possibility of a flag pattern forming, continue to support the bearish scenario.
Support and resistance levels
Resistance levels: 2500.00, 2812.50, 3125.00.
Support levels: 1875.00, 1481.50, 1250.00.
Trading scenarios and ETH/USD forecast
Short positions may be considered below 1875.00 with targets at 1481.50 and 1250.00, and a stop-loss at 2070.00. Implementation period: 5–7 days. Long positions may be considered above 2500.00 with targets at 2812.50 and 3125.00, and a stop-loss at 2315.00.
Scenario
| Timeframe | Weekly |
| Recommendation | SELL STOP |
| Entry point | 1845.00 |
| Take Profit | 1481.50, 1250.00 |
| Stop Loss | 2070.00 |
| Key levels | 1250.00, 1481.50, 1875.00, 2500.00, 2812.50, 3125.00 |
Alternative scenario
| Recommendation | BUY STOP |
| Entry point | 2530.00 |
| Take Profit | 2812.50, 3125.00 |
| Stop Loss | 2315.00 |
| Key levels | 1250.00, 1481.50, 1875.00, 2500.00, 2812.50, 3125.00 |
