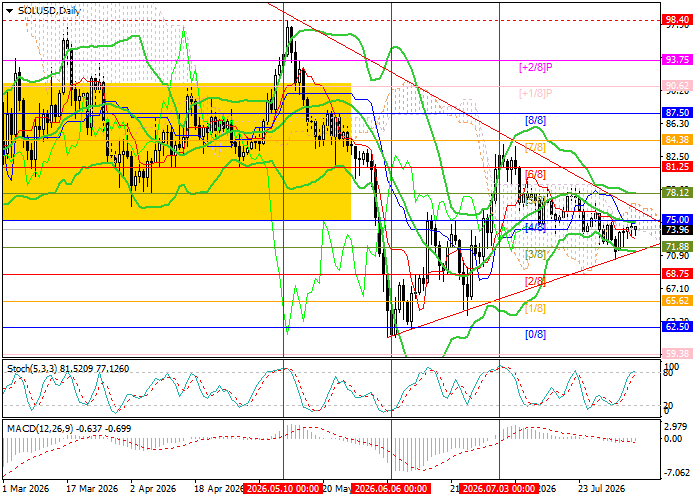
SOL/USD has been trending lower since last month. However, the pair has recently recovered part of its losses and is now trading near the middle Bollinger Band at 75.00, the Murrey [4/8] level. Overall, the chart resembles a Symmetrical Triangle pattern, which could break in either direction. If the price consolidates below the lower Bollinger Band at 71.88, the Murrey [3/8] level, the decline may continue toward 62.50, the Murrey [0/8] level, and 56.25, the Murrey [–2/8] level. However, a breakout above 78.12, the Murrey [5/8] level, could support a renewed advance toward 87.50, the Murrey [8/8] level, 93.75, the Murrey [+2/8] level, and 98.40, the area of the May highs.
Technical indicators continue to favour the bearish scenario. The Bollinger Bands are moving lower, the MACD histogram has entered negative territory, while the Stochastic Oscillator has reached the overbought zone and may reverse downward. On the weekly chart, the Bollinger Bands and the Stochastic Oscillator are also pointing lower, confirming that the longer-term downtrend remains intact.
Support and Resistance Levels
Resistance levels: 78.12, 87.50, 93.75, 98.40.
Support levels: 71.88, 62.50, 56.25.
SOL/USD Trading Scenarios and Price Forecast
Short positions may be opened below 71.88 with targets at 62.50 and 56.25 and a stop-loss at 76.20. Time horizon: 5–7 days.
Long positions may be opened above 78.12 with targets at 87.50, 93.75 and 98.40 and a stop-loss at 74.00.
John Isige is an experienced cryptocurrency journalist and market analyst specializing in digital assets, blockchain innovation, and emerging Web3 trends. He provides clear, actionable market insights for traders and investors, with particular expertise in DeFi, smart contracts, NFTs, RWAs, and AI-powered blockchain ecosystems. His commentary and analysis have been featured in FORECK.INFO, CoinGape, CryptoNews, and other leading digital finance publications