

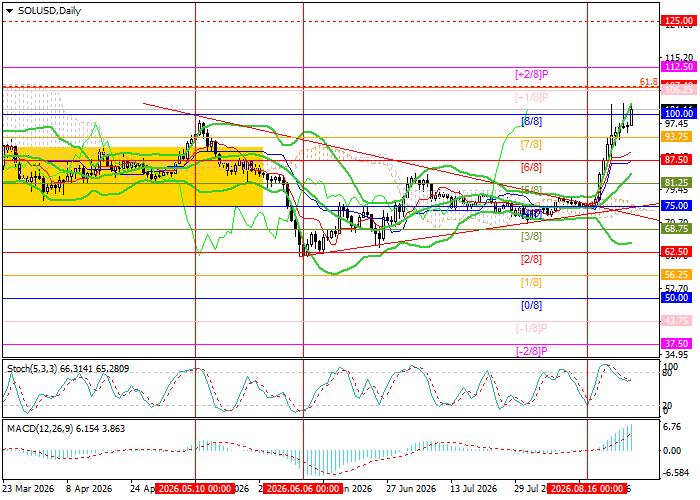
Technical indicators continue to support a buying signal: Bollinger Bands are turning upward, the MACD histogram is expanding in positive territory, while the Stochastic oscillator has turned lower from the overbought zone, suggesting the possibility of a limited correction. On the weekly chart, Bollinger Bands are also attempting to move higher, and the MACD histogram is preparing to enter positive territory, increasing the probability of further upside momentum.
Support and resistance levels
Support levels: 81.25, 62.50, 50.00.
Resistance levels: 100.00, 112.50, 125.00.
SOL/USD Trading Scenarios and Price Forecast
Long positions can be opened from the 102.00 level with targets at 112.50 and 125.00, with a stop-loss at 96.00. Expected timeframe: 5–7 days.
Short positions can be opened from the 81.25 level with targets at 62.50 and 50.00, with a stop-loss at 91.00.
Scenario
| Timeframe | Weekly |
| Recommendation | BUY STOP |
| Entry point | 102.00 |
| Take Profit | 112.50, 125.00 |
| Stop Loss | 96.00 |
| Key levels | 50.00, 62.50, 81.25, 100.00, 112.50, 125.00 |
Alternative Scenario
| Recommendation | SELL STOP |
| Entry point | 81.25 |
| Take Profit | 62.50, 50.00 |
| Stop Loss | 91.00 |
| Key levels | 50.00, 62.50, 81.25, 100.00, 112.50, 125.00 |
