

Over the weekend, US President Donald Trump stated that American armed forces would strike Iranian energy facilities if the Strait of Hormuz, through which up to 20.0% of global energy supplies pass, is not reopened. However, as early as Monday, that decision was postponed for five days because, according to the White House, “important points of contact” had been found with representatives of the Islamic Republic, suggesting that a peace agreement could be reached soon. Official Tehran категорically denied this information, while reiterating its readiness to launch retaliatory strikes against the energy and oil sectors of Gulf countries. Meanwhile, it became known that Saudi Arabia and the United Arab Emirates had granted the Pentagon access to their military bases, which could further escalate the conflict. The situation is becoming increasingly uncertain, forcing investors to avoid active positioning in digital assets. This caution is also reinforced by mixed signals from the US Federal Reserve regarding future monetary policy. Last week, the regulator kept interest rates unchanged in the 3.50–3.75% range, hinting at a pause in adjustments over the medium term due to unclear inflation prospects. A prolonged period of current policy settings is a negative signal for risk assets, yet that decision does not rule out a return to a more hawkish stance later. According to recent comments from Fed officials, tighter monetary conditions remain likely if consumer inflation stays above the 2.0% target, but rate cuts by the end of the year are equally possible if the inflation spike proves temporary and the labor market remains under pressure. This view is shared, for example, by Governor Christopher Waller. All of these factors are contributing to subdued activity in the market, as reflected by the Fear & Greed Index, which, although it has risen to 11, remains firmly in the “extreme fear” zone. Investment flows into Ripple ETFs also remain extremely weak, with last week showing inflows of just 0.25 million dollars.
Support and resistance levels
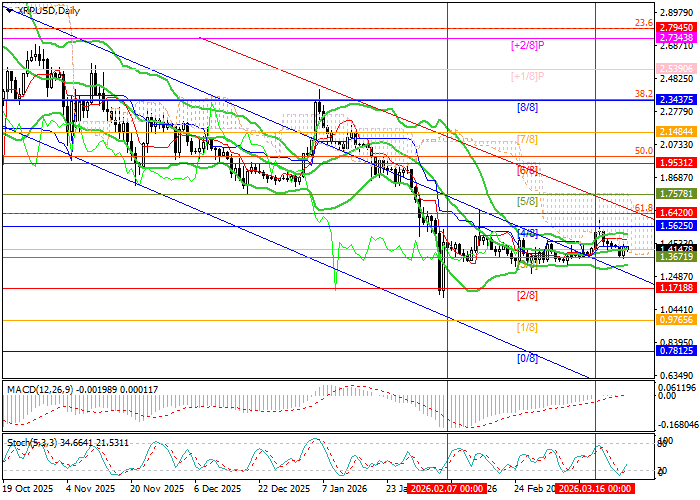
The XRP/USD pair is trading within the 1.5625–1.3671 range (Murray [4/8]–[3/8]), and a more significant move will likely become possible only once the price exits this channel decisively. A break below the lower boundary would allow bears to target the 0.9765 area (Murray [1/8]) and 0.7812 (Murray [0/8]). On the upside, the key resistance zone for bulls is seen at 1.5625–1.6420 (Murray [4/8], 61.8% Fibonacci retracement). A breakout above this area would mean an exit from the descending channel through the upper boundary and open the path toward 1.9531 (Murray [6/8]) and 2.3437 (Murray [8/8], 38.2% Fibonacci retracement).
Technical indicators do not provide a unified signal. Bollinger Bands remain horizontal, the MACD histogram is hovering near the zero line with low volume, while Stochastic is turning upward from the oversold zone. It should also be noted that on the weekly chart, Bollinger Bands are still pointing downward, confirming the persistence of the long-term bearish trend, as well as signs of a developing flag pattern.
Resistance levels: 1.5625, 1.6420, 1.9531, 2.3437.
Support levels: 1.3671, 0.9765, 0.7812.
Trading scenarios and XRP/USD forecast
Short positions may be considered below 1.3671 with targets at 0.9765 and 0.7812, and a stop-loss at 1.5630. Implementation period: 5–7 days.
Long positions may be considered above 1.6420 with targets at 1.9531 and 2.3437, and a stop-loss at 1.4200.
Scenario
| Timeframe | Weekly |
| Recommendation | SELL STOP |
| Entry point | 1.3650 |
| Take Profit | 0.9765, 0.7812 |
| Stop Loss | 1.5630 |
| Key levels | 0.7812, 0.9765, 1.3671, 1.5625, 1.6420, 1.9531, 2.3437 |
Alternative scenario
| Recommendation | BUY STOP |
| Entry point | 1.6430 |
| Take Profit | 1.9531, 2.3437 |
| Stop Loss | 1.4200 |
| Key levels | 0.7812, 0.9765, 1.3671, 1.5625, 1.6420, 1.9531, 2.3437 |
