

The Middle East situation continues to evolve rapidly. On Tuesday, investors were bracing for a resumption of open hostilities following Iranian strikes on UAE oil infrastructure and White House plans to launch "Project Freedom" to unblock the Strait of Hormuz. Today, however, market tensions are easing after President Donald Trump announced a pause in the campaign amid progress toward a peace deal with Tehran — one that could potentially be signed in the near term. Reports of a likely diplomatic resolution have boosted investor appetite for risk assets, lending support to leading tokens.
Price action is also being supported by a compromise reached between the banking and crypto industries on the CLARITY Act, which would prohibit virtual asset service providers from offering clients returns based solely on holding tokens — as such programs resemble ordinary bank deposits and could trigger capital outflows from the traditional financial system — while preserving rewards for stablecoin transactions. Ripple CEO Brad Garlinghouse noted that the bill is not perfect but brings much-needed legal clarity, and expressed concern that if it is not passed within the next two weeks, approval could be delayed until at least November amid preparations for the congressional elections.
Overall, sentiment in the crypto space is gradually improving, as confirmed by the Fear and Greed Index rising to 46 and a renewed inflow of investment into digital ETFs. Since the start of the month, Ripple ETF balances have grown by $10.9 million. That said, upside momentum may slow on Friday following the release of US labor market data at 14:30 (GMT+2), if the figures confirm labor market resilience and reinforce the likelihood of the Fed holding rates for an extended period.
Support and Resistance Levels
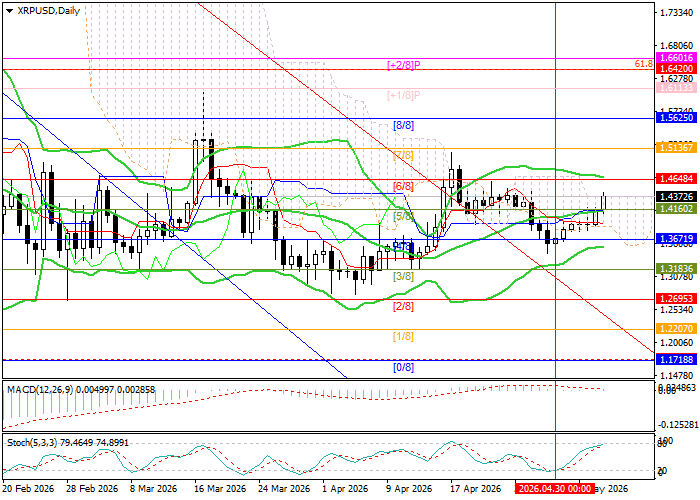
The pair has been moving within a medium-term sideways range of 1.5625–1.2695 (Murray levels [8/8]–[2/8]) for the third consecutive month. The price has now risen above the Bollinger Bands midline and is moving toward 1.4648 (Murray [6/8]). A breakout above this level would open the way toward 1.5625 (Murray [8/8]) and 1.6420 (Fibonacci 61.8% retracement). However, a break below 1.3671 (Murray [4/8]) could extend the downside toward the lower boundary of the range at 1.2695 (Murray [2/8]) and further into the 1.0742 (Murray [–2/8]) and 0.7812 (Murray [2/8], W1) zones.
Technical indicators are not sending a unified signal: Bollinger Bands are moving horizontally, the MACD histogram is near the zero line with minimal volume, and the Stochastic has reached overbought territory and may turn lower.
Resistance levels: 1.4648, 1.5625, 1.6420.
Support levels: 1.3671, 1.2695, 1.0742, 0.7812.
XRP/USD Trading Scenarios and Forecast
Long positions may be opened above 1.4648, targeting 1.5625 and 1.6420, with a stop-loss at 1.3900. Time horizon: 5–7 days.
Short positions may be opened below 1.3671, targeting 1.2695, 1.0742, and 0.7812, with a stop-loss at 1.4500.
Scenario
| Timeframe | Weekly |
| Recommendation | BUY STOP |
| Entry Point | 1.4700 |
| Take Profit | 1.5625, 1.6420 |
| Stop Loss | 1.3900 |
| Key Levels | 0.7812, 1.0742, 1.2695, 1.3671, 1.4648, 1.5625, 1.6420 |
Alternative Scenario
| Recommendation | SELL STOP |
| Entry Point | 1.3600 |
| Take Profit | 1.2695, 1.0742, 0.7812 |
| Stop Loss | 1.4500 |
| Key Levels | 0.7812, 1.0742, 1.2695, 1.3671, 1.4648, 1.5625, 1.6420 |
