

The asset is being supported by reports of a compromise between representatives of the banking and digital industries on the Crypto Asset National Legislative Transparency and Responsible Handling Act (CLARITY Act), the updated text of which was published on Friday. The bill prohibits stablecoin issuers from offering customers returns based solely on holding stable tokens, as such programs resemble ordinary bank deposits and could trigger a capital outflow from the traditional financial system — though other forms of rewards for transactions with the coins may be retained. Analysts note that the new bill will force industry players to shift their token-holding reward model from a "buy and hold" to a "buy and use" approach. The agreement was welcomed positively by the market, as it allows the document to bypass additional hearings in the Senate Banking Committee and may accelerate its passage. Recall that Galaxy Digital CEO Mike Novogratz previously projected that the CLARITY Act would receive final approval in early May and be signed by President Donald Trump in June. Against this backdrop, Bitcoin ETF inflows surged sharply, pushing the weekly balance into positive territory at $162.8 million, while the Fear and Greed Index climbed to 40, approaching the neutral zone.
Nevertheless, despite the broader improvement in sentiment across the digital asset space, the upward momentum still looks fragile due to persistent geopolitical and monetary uncertainty. Hostilities in the Middle East could resume at any moment, and the Strait of Hormuz remains blocked, deepening the global energy crisis. In addition, the latest Fed meeting reflected officials' reluctance to cut interest rates in the medium term given the risk of accelerating inflation, though incoming Fed Chair Kevin Warsh will likely attempt to steer the Board toward more dovish rhetoric.
It is worth noting that the crypto market is attracting growing interest from large institutional investors, but not from ordinary citizens — as illustrated by a CoinDesk survey in which more than 65.0% of respondents said they trust commercial banks more, and only 5.0% expressed a commitment to the digital space.
Overall, the fundamental case for further BTC/USD appreciation remains intact, though a number of geopolitical and monetary factors are acting as headwinds in the near term.
Support and Resistance Levels
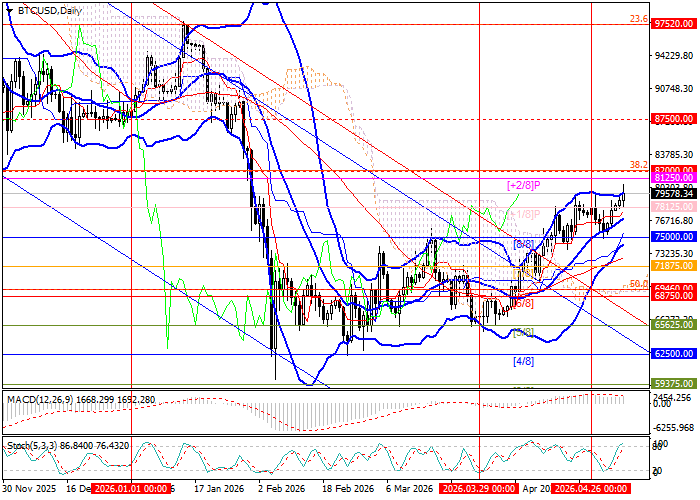
The asset is approaching the resistance zone at 82000.00–81250.00 (Fibonacci 38.2% retracement, Murray [+2/8]). A breakout above this area would open the way toward 87500.00 (Murray [3/8], W1) and 97520.00 (Fibonacci 23.6% retracement). However, a renewed break below 75000.00 (Murray [8/8]) — reinforced by the lower Bollinger Band — could resume the move toward 68750.00 (Murray [6/8], Fibonacci 50.0%) and 62500.00 (Murray [4/8]).
Technical indicators are not sending a unified signal: Bollinger Bands are pointing upward and the MACD histogram is stable in positive territory, but the Stochastic has reached overbought levels, leaving open the possibility of a reversal.
Resistance levels: 82000.00, 87500.00, 97520.00.
Support levels: 75000.00, 68750.00, 62500.00.
BTC/USD Trading Scenarios and Forecast
Long positions may be opened above 82000.00, targeting 87500.00 and 97520.00, with a stop-loss at 77600.00. Time horizon: 5–7 days.
Short positions may be opened below 75000.00, targeting 68750.00 and 62500.00, with a stop-loss at 77100.00.
Scenario
| Timeframe | Weekly |
| Recommendation | BUY STOP |
| Entry Point | 82000.05 |
| Take Profit | 87500.00, 97520.00 |
| Stop Loss | 77600.00 |
| Key Levels | 62500.00, 68750.00, 75000.00, 82000.00, 87500.00, 97520.00 |
Alternative Scenario
| Recommendation | SELL STOP |
| Entry Point | 74999.95 |
| Take Profit | 68750.00, 62500.00 |
| Stop Loss | 77100.00 |
| Key Levels | 62500.00, 68750.00, 75000.00, 82000.00, 87500.00, 97520.00 |
