

Sentiment toward major digital assets was also affected by the outcome of the latest US Federal Reserve meeting, which made investors more cautious and supported demand for the US dollar. As expected, the federal funds target range was left unchanged at 3.50–3.75%. However, three members of the Federal Open Market Committee (FOMC) — Cleveland Fed President Beth Hammack, Minneapolis Fed President Neel Kashkari and Dallas Fed President Lorie Logan — voted in favour of raising the target range by 25 basis points. Their position reflects growing concern about inflation, which has remained above the regulator’s 2.0% target. The Fed may therefore shift toward a more hawkish policy stance, potentially putting additional pressure on assets that compete with the US currency.
Additional pressure on BTC and the broader cryptocurrency market has come from the continuing theft of funds from wallets whose keys were generated using weak randomness in a vulnerable March 2021 version of Coldcard firmware. Since July 30, three major waves of wallet sweeps have been identified. According to CoinDesk, a total of 4,585 addresses were affected, with attackers stealing 1,367 BTC worth approximately 89.0 million dollars. Against this backdrop, US spot Bitcoin ETFs recorded net outflows of approximately 61.5 million dollars during the week ending July 31.
It is worth noting that the decline may slow in the near term as geopolitical tensions in the Middle East show signs of easing. Over the weekend, US President Donald Trump said the United States would cancel a planned attack on Iran, provided that a rapid agreement could be reached on the Strait of Hormuz and Iran’s nuclear programme. These statements initially encouraged market participants and strengthened risk appetite. However, Iranian officials subsequently denied that negotiations with the United States had been scheduled, meaning uncertainty in the region remains elevated.
Overall sentiment in the cryptocurrency sector remains negative, as confirmed by the Crypto Fear and Greed Index, which remains in the “Fear” zone at around 28.
Support and Resistance Levels
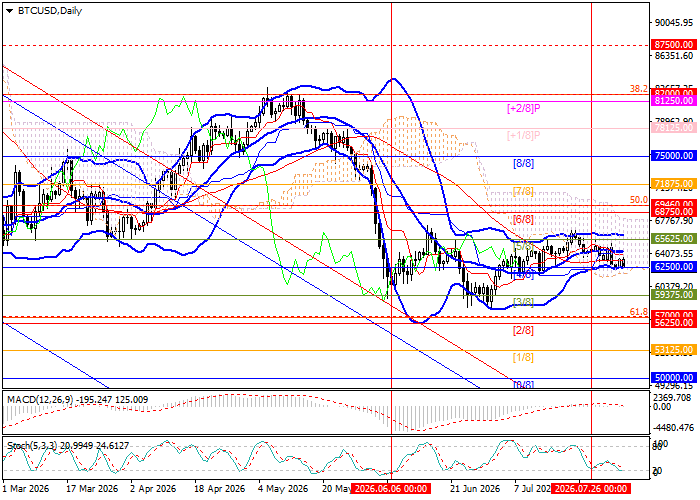
The trading instrument remains within the sideways range of 65625.00–59375.00, corresponding to the Murrey [5/8]–[3/8] levels, which it entered two months ago. A breakdown below the lower Bollinger Band at 62500.00, the Murrey [4/8] level, could extend the decline toward 59375.00, the Murrey [3/8] level, followed by 57000.00, the 61.8% Fibonacci retracement, and 50000.00, the Murrey [0/8] level. However, a renewed breakout above 65625.00, the Murrey [5/8] level, could support an advance toward 69460.00, the 50.0% Fibonacci retracement, and 75000.00, the Murrey [8/8] level.
Technical indicators do not provide a unified signal. The Bollinger Bands are moving horizontally, the MACD histogram remains close to the zero line with low volumes, while the Stochastic Oscillator has entered the oversold zone and may reverse upward.
Resistance levels: 65625.00, 69460.00, 75000.00.
Support levels: 62500.00, 59375.00, 57000.00, 50000.00.
BTC/USD Trading Scenarios and Price Forecast
Short positions may be opened below 62500.00 with targets at 59375.00, 57000.00 and 50000.00 and a stop-loss at 64700.00. Time horizon: 5–7 days.
Long positions may be opened above 65625.00 with targets at 69460.00 and 75000.00 and a stop-loss at 63100.00.
Scenario
| Timeframe | Weekly |
| Recommendation | SELL STOP |
| Entry Point | 62500.00 |
| Take Profit | 59375.00, 57000.00, 50000.00 |
| Stop Loss | 64700.00 |
| Key Levels | 50000.00, 57000.00, 59375.00, 62500.00, 65625.00, 69460.00, 75000.00 |
Alternative Scenario
| Recommendation | BUY STOP |
| Entry Point | 65625.00 |
| Take Profit | 69460.00, 75000.00 |
| Stop Loss | 63100.00 |
| Key Levels | 50000.00, 57000.00, 59375.00, 62500.00, 65625.00, 69460.00, 75000.00 |
