

The dollar remained firm as traders priced in a Federal Reserve rate increase in December. US consumer prices rose 0.4% month on month in October against a 0.3% forecast, while core inflation came in at 0.3% against expectations of 0.2%. October nonfarm payrolls rose by 165,000 and unemployment edged down to 4.1%. CME FedWatch figures reported by Reuters on November 16 put the odds of a 25-basis-point increase on December 9 at 91.1% and those of a 50-basis-point move at 8.9%.
Nvidia’s leadership change added to volatility in AI-linked stocks. Co-founder Jensen Huang resigned as chief executive, and the company named Chief Financial Officer Colette Kress as interim CEO, according to its SEC filing. On Friday, as Bitcoin extended the decline covered in our previous BTC/USD outlook, 24-hour crypto liquidations topped $1.6 billion, according to CoinDesk.
This week, investors are watching Nvidia’s earnings and Anthropic’s planned IPO for signs of demand for AI stocks. Anthropic’s shares are expected to begin trading on Nasdaq on November 19 under the ticker ANT, according to Reuters.
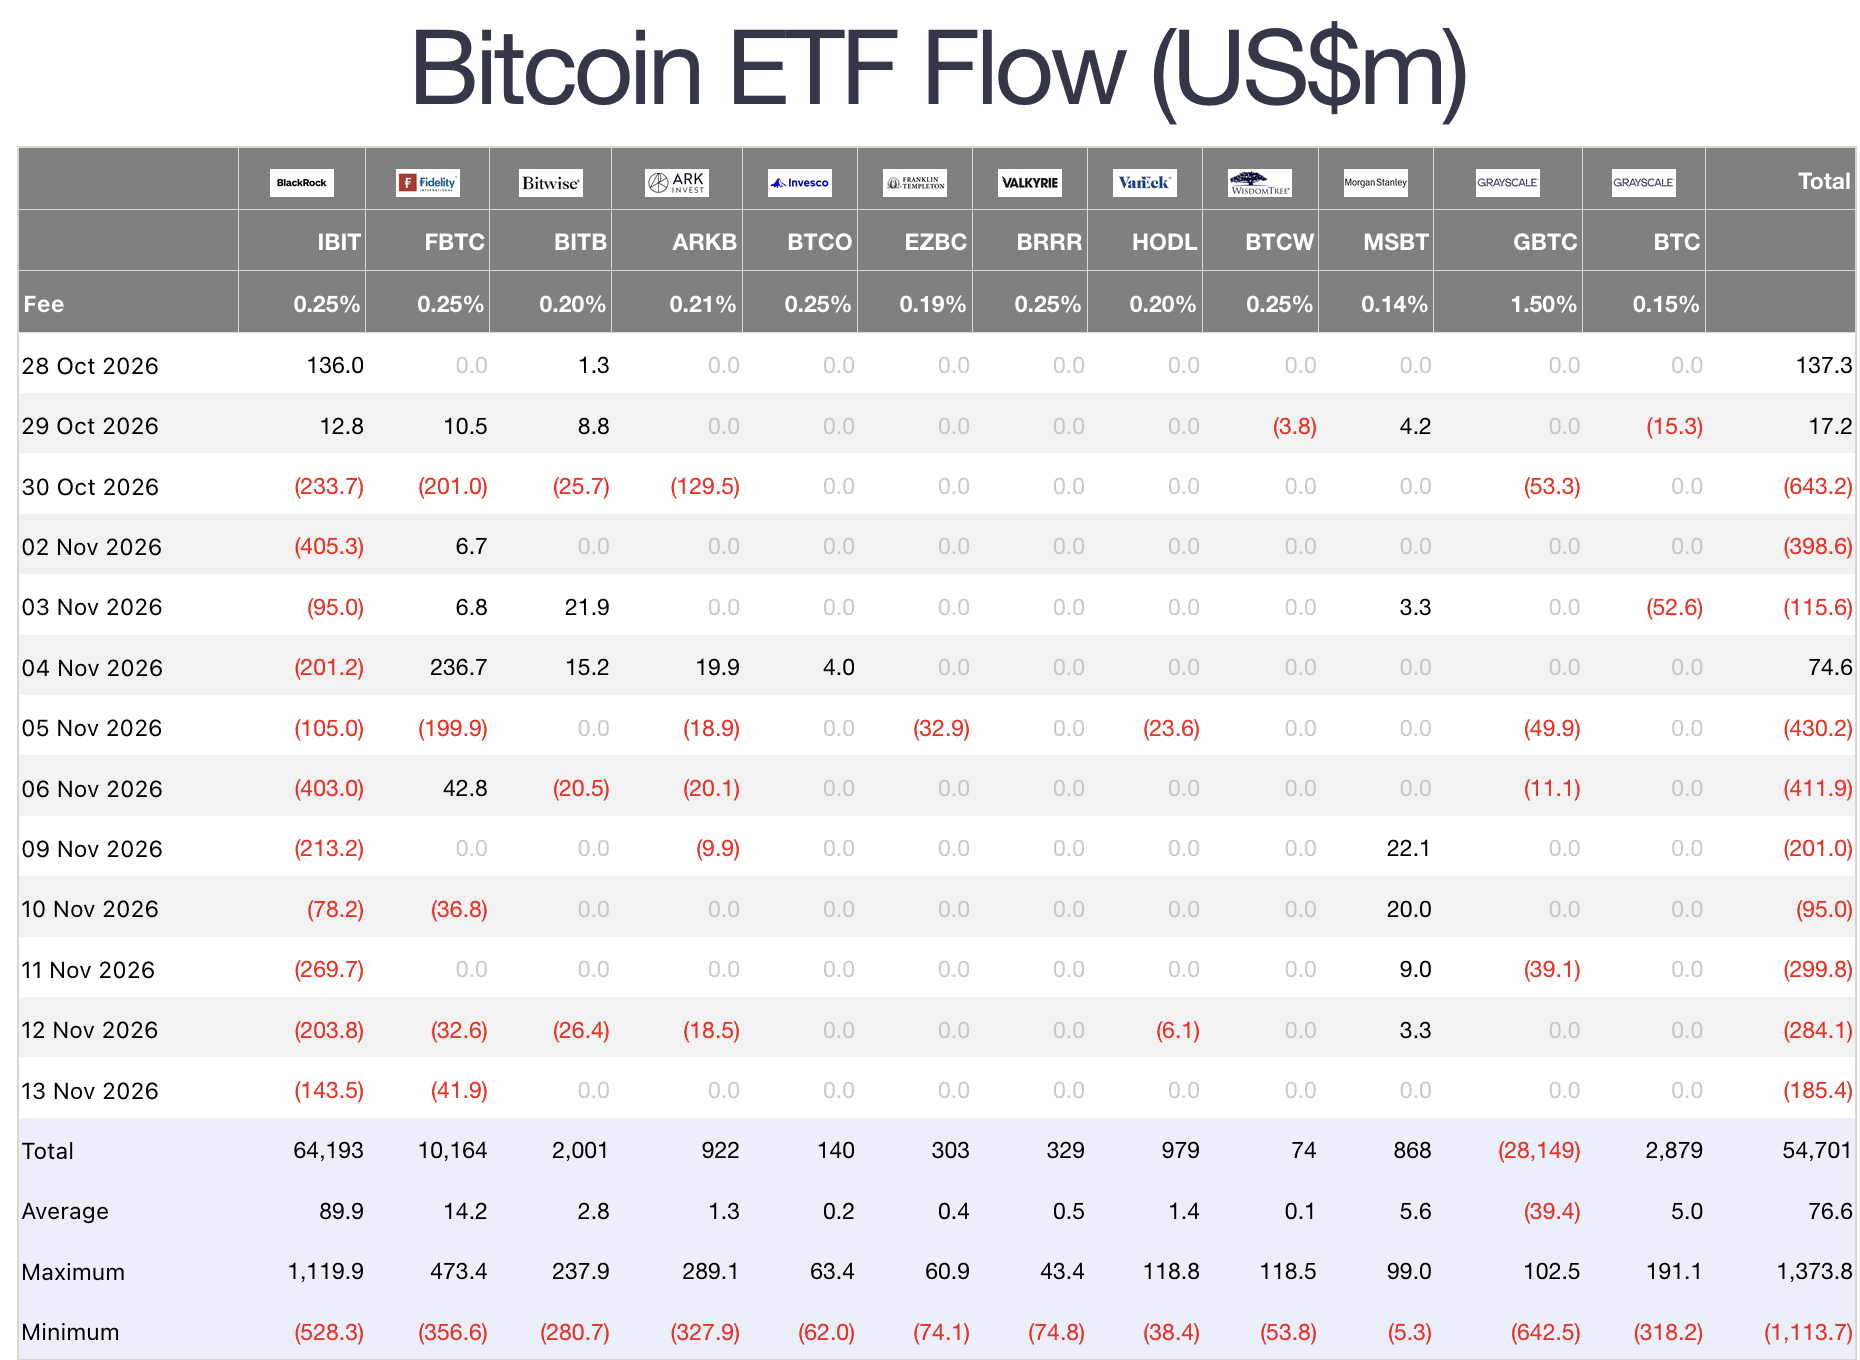
US spot Bitcoin ETFs recorded about $1.065 billion in net outflows over the five sessions from November 9 through November 13, according to Farside Investors. The Crypto Fear & Greed Index stood at 10 on November 16, in the Extreme Fear category.
Support and resistance levels
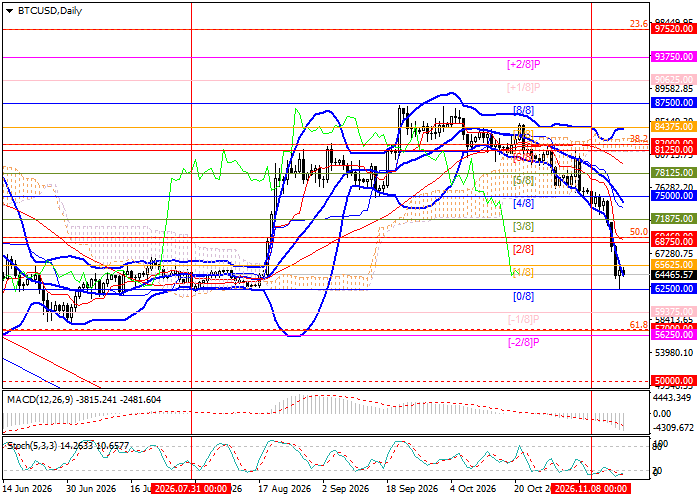
BTC/USD has been trending lower since early October. The pair briefly dipped below 62500.00 (Murrey Math [0/8]) over the weekend before recovering. A sustained break below that level could expose 56250.00 (Murrey Math [−2/8] and the 61.8% Fibonacci retracement), followed by 50000.00 (weekly [0/8]). A sustained move above the middle Bollinger Band at 75000.00 (Murrey Math [4/8]) could open the way to 82000.00 (38.2% Fibonacci retracement) and 87500.00 (Murrey Math [8/8]).
Technical indicators still favor the downside. The Bollinger Bands are turning lower and the MACD histogram is extending below zero. The Stochastic oscillator is in oversold territory, leaving room for a short-term rebound.
Resistance levels are 75000.00, 82000.00, and 87500.00.
Support levels are 62500.00, 56250.00, and 50000.00.
Trading scenarios and BTC/USD forecast
A sustained break below 62500.00 could trigger the short setup, with targets at 56250.00 and 50000.00 and a stop-loss at 66200.00. The expected time horizon is five to seven days.
A sustained move above 75000.00 could trigger the long setup, with targets at 82000.00 and 87500.00 and a stop-loss at 71200.00.
Scenario
| Time frame | Weekly |
| Recommendation | SELL STOP |
| Entry point | 62500.00 |
| Take Profit | 56250.00, 50000.00 |
| Stop Loss | 66200.00 |
| Key levels | 50000.00, 56250.00, 62500.00, 75000.00, 82000.00, 87500.00 |
Alternative scenario
| Recommendation | BUY STOP |
| Entry point | 75000.00 |
| Take Profit | 82000.00, 87500.00 |
| Stop Loss | 71200.00 |
| Key levels | 50000.00, 56250.00, 62500.00, 75000.00, 82000.00, 87500.00 |
