

Prices initially benefited from hopes that easing geopolitical tensions in the Persian Gulf would slow energy price increases, reduce inflation risks, and lessen the need for urgent monetary tightening by the Federal Reserve. However, concerns about slower development of the cryptocurrency sector subsequently weighed on sentiment. Some Democratic lawmakers advocate tighter oversight of technology companies and have called for legislation protecting consumers from electricity price increases associated with data centres. Independent Senator Bernie Sanders has also proposed a nationwide moratorium on new AI data centres, citing environmental damage and potential job losses. The Biden administration previously expressed concerns about risks that digital assets could pose to the financial system. Some industry analysts now expect progress on the Digital Asset Market Clarity Act, known as the CLARITY Act, to remain stalled until 2028. They also warn that any revised proposal could be more restrictive toward the sector than the current version.
Additional pressure came from Friday’s strong US employment data. According to the Bureau of Labor Statistics’ October report, unemployment declined from 4.2% to 4.1%, while nonfarm payrolls increased by 165,000, significantly exceeding forecasts of 65,000. The resilience of employment gives the Federal Reserve more room to focus on inflation, which remains above its 2.0% target. Published CME FedWatch readings placed the probability of a December rate increase at approximately 77% by Friday, compared with around 66% earlier in the week.
Overall cryptocurrency market sentiment remains negative, extending the weakness discussed in our previous BTC/USD forecast. US spot Bitcoin ETFs recorded net outflows of approximately $1.282 billion during November 2–6, while the Crypto Fear & Greed Index stood at 29, within the “Fear” zone. Against this backdrop, further near-term weakness in BTC/USD remains possible.
Support and Resistance Levels
The instrument has been forming a downtrend since the beginning of last month. The price has broken below 75000.00 (Murray level [0/8]), opening the way toward 69460.00 (50.0% Fibonacci retracement) and 66500.00. However, a breakout above the middle Bollinger Band at 78125.00 (Murray level [2/8]) could support a recovery toward 82000.00 (38.2% Fibonacci retracement) and 85937.50 (Murray level [7/8]).
Technical indicators maintain a sell signal: the Bollinger Bands are turning downward, the MACD histogram is expanding in negative territory, and the Stochastic oscillator has reached the oversold zone, leaving room for a limited upward correction.
Resistance levels: 78125.00, 82000.00, 85937.50.
Support levels: 69460.00, 66500.00.
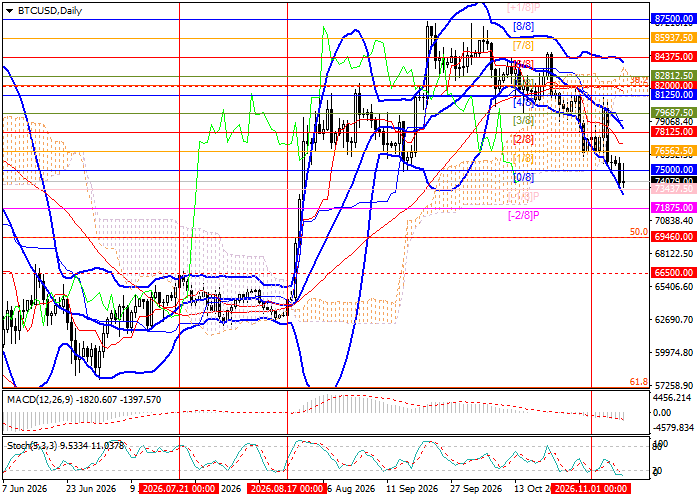
BTC/USD Trading Scenarios and Bitcoin Price Forecast
Short positions may be considered from 73000.00, with targets at 69460.00 and 66500.00 and a stop-loss at 75200.00. The estimated holding period is 5–7 days. Long positions may be considered above 78125.00, with targets at 82000.00 and 85937.50 and a stop-loss at 75800.00.
Scenario
| Timeframe | Weekly |
| Recommendation | SELL STOP |
| Entry Point | 73000.00 |
| Take Profit | 69460.00, 66500.00 |
| Stop Loss | 75200.00 |
| Key Levels | 66500.00, 69460.00, 78125.00, 82000.00, 85937.50 |
Alternative Scenario
| Recommendation | BUY STOP |
| Entry Point | 78125.00 |
| Take Profit | 82000.00, 85937.50 |
| Stop Loss | 75800.00 |
| Key Levels | 66500.00, 69460.00, 78125.00, 82000.00, 85937.50 |
