

The armed conflict between the US and Iran continues to escalate. Over the weekend, US President Donald Trump issued an ultimatum demanding that Iran fully unblock the Strait of Hormuz, warning that otherwise the Islamic Republic’s energy infrastructure would be targeted. In response, Tehran threatened to destroy similar infrastructure in Israel and the Gulf states. If both sides act on these threats, oil prices could rise to 150.00, significantly increasing the risk of a global economic slowdown. Against this backdrop, analysts at The Goldman Sachs Group Inc. raised their forecast for Brent Crude Oil this year from 77.00 to 85.00, and for WTI Crude Oil from 72.00 to 79.00, which is materially reducing investor appetite for risk. At the same time, the US dollar is receiving stronger monetary support, as Federal Reserve officials are increasingly considering keeping policy tight for longer or even tightening further. In February, the consumer price index rose by 2.4% year-on-year, while the core indicator stood at 2.5%, both remaining above the 2.0% target. At its latest meeting, the Fed raised its average annual inflation forecast to 2.7%, which could imply a full отказ from rate cuts until early 2027 — a scenario currently supported by 7 of the 19 policymakers.
Under these conditions, overall sentiment across the crypto market remains negative. The Fear & Greed Index has returned to its yearly low of 8 in the “extreme fear” zone, while Bitcoin ETF balances have declined by 305.7 billion dollars over the last three sessions, although the weekly trend remained positive, with net inflows of 93.1 million dollars. One positive development for the digital asset community is faster progress in the US Senate on the CLARITY Act. According to Politico sources, key negotiators — Republican Thom Tillis and Democrat Angela Alsobrooks — have reached a preliminary agreement on the treatment of stablecoin yield, aiming to support financial innovation while easing concerns over capital outflows from traditional deposits. Nevertheless, long-term fundamental pressures continue to dominate the market and are outweighing any positive impulse.
Support and resistance levels
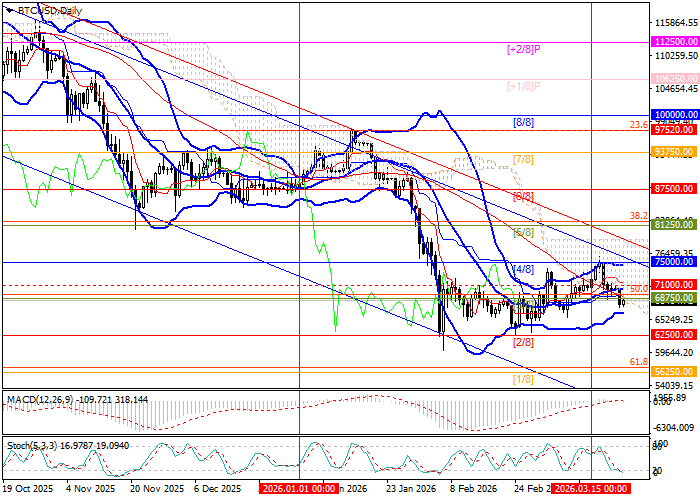
The instrument has moved below the 68750.00 mark (Murray [3/8] level) and may continue its decline toward 62500.00 (Murray [2/8] level) and 56250.00 (Murray [1/8] level, 61.8% Fibonacci retracement). However, if the price reverses and rises above the middle Bollinger Band at 71000.00, growth toward 75000.00 (Murray [4/8] level) and 81250.00 (Murray [5/8] level, 38.2% Fibonacci retracement) may follow.
Technical indicators are not providing a unified signal. Bollinger Bands are flattening horizontally, the MACD histogram remains near the zero line with low volumes, and the Stochastic oscillator is moving sideways near the oversold area. On the weekly chart, Bollinger Bands continue to show negative dynamics, confirming the persistence of the broader bearish trend, while the price chart shows signs of forming a flag pattern.
Resistance levels: 71000.00, 75000.00, 81250.00.
Support levels: 68750.00, 62500.00, 56250.00.
Trading scenarios and BTC/USD forecast
Short positions may be considered from 67200.00 with targets at 62500.00 and 56250.00, and a stop-loss at 70700.00. Implementation period: 5–7 days.
Long positions may be considered above 71000.00 with targets at 75000.00 and 81250.00, and a stop-loss at 67800.00.
Scenario
| Timeframe | Weekly |
| Recommendation | SELL STOP |
| Entry point | 67200.00 |
| Take Profit | 62500.00, 56250.00 |
| Stop Loss | 70700.00 |
| Key levels | 56250.00, 62500.00, 68750.00, 71000.00, 75000.00, 81250.00 |
Alternative scenario
| Recommendation | BUY STOP |
| Entry point | 71050.00 |
| Take Profit | 75000.00, 81250.00 |
| Stop Loss | 67800.00 |
| Key levels | 56250.00, 62500.00, 68750.00, 71000.00, 75000.00, 81250.00 |
