

Solana (SOL) is at a crossroads, its recent market behavior leaving traders in suspense. After breaking out of a textbook ascending triangle on the daily chart, the cryptocurrency saw its upward momentum run into a familiar ceiling—the notorious yellow resistance zone. This band, well-known among market participants, once again proved to be a magnet for institutional sellers eager to lock in short-term gains. The price, unable to push through, has now settled into a period of sideways movement, clinging to the upper boundary of the prior pattern, which now acts as a critical support zone.
What’s at stake? Technically, we’re looking at a classic retest scenario, a moment when the market often telegraphs its intentions for the next major move. Yet the situation is layered: macroeconomic variables—from looming interest rate announcements to U.S. labor market prints and the ever-present speculation around crypto ETFs—are adding extra uncertainty. Should Solana’s price falter and close below this retest level on a daily basis, the risk of a sharper correction becomes difficult to ignore.
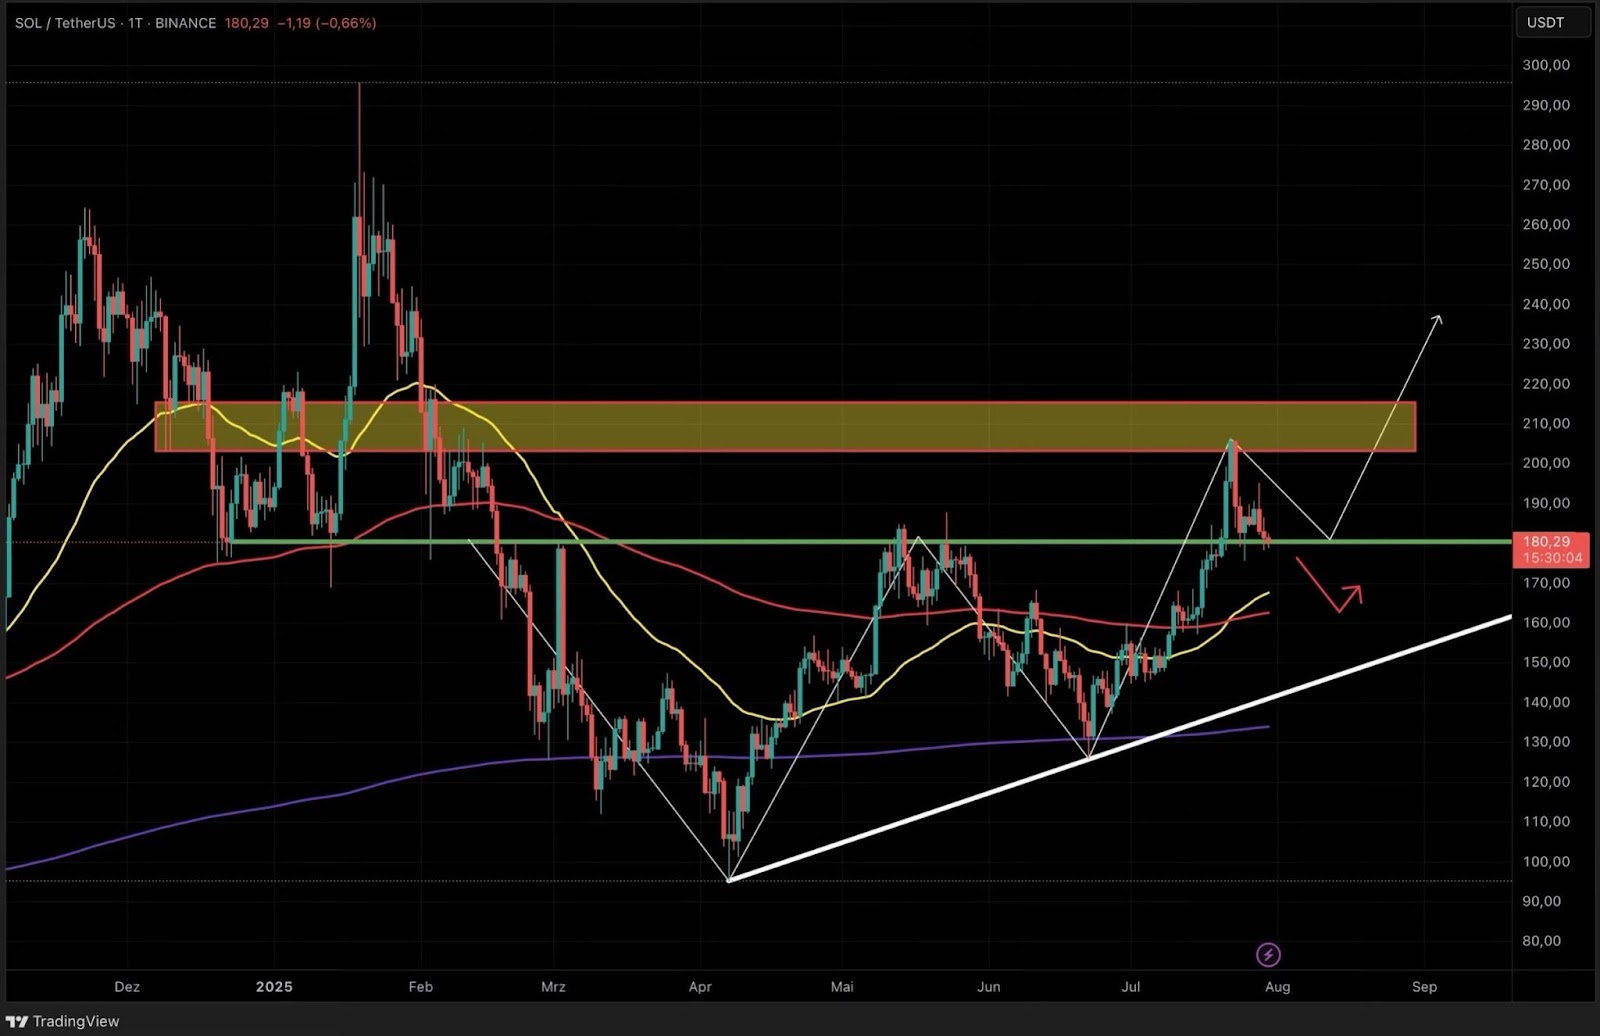 Solana daily: Major breakout, now retest
Short-Term Structure: Compression and Imminent Decision
Zooming into the 4-hour chart, the plot thickens. Price action suggests the early formation of a new ascending triangle—though the lower support remains up for debate. We’re witnessing a textbook volatility squeeze, as the trading range narrows and tension builds. A run at the sloping red resistance line and subsequent rejection would validate the current triangle thesis. On the downside, a short-term support shelf—underpinned by the 200-period EMA—serves as the last bastion for the bulls. A breakdown here and all eyes shift to green support bands mapped from prior reaction lows.
Should the price overcome the cluster of resistance formed by the yellow horizontal band and the red diagonal, it could trigger an outsized bullish move—a technical breakout watched closely by both discretionary and systematic traders. Conversely, a failure to hold support would likely accelerate selling into historically significant demand zones.
 Solana 4h chart: Pattern coil tightens
Market Outlook: Chart Structure Meets Macro Volatility
In short, Solana’s current market structure is balanced on a knife’s edge. The daily retest provides a familiar bullish template, but the intraday squeeze highlights how nervous and reactive the order book has become. A move in either direction could be amplified by headline risk in the coming days. If history is any guide, periods of low volatility and tight range compression in SOL rarely last long—meaning traders should expect an uptick in momentum, whichever side prevails.