
The upward trend is driven by uncertainty surrounding the Federal Reserve’s next steps, as incoming macroeconomic data could push officials either toward further interest rate cuts or toward keeping rates unchanged. In November, unemployment rose to its highest level since 2021 at 4.6%, while inflationary pressure eased over the same period: the Consumer Price Index declined from 3.0% to 2.7%, and the core CPI fell from 3.0% to 2.6%. This shift has tilted economic risks toward labor market cooling, implying room for monetary easing. At the same time, GDP growth of 4.3% in the third quarter has revived concerns about renewed inflationary pressure, making the outlook for a clearly dovish stance in early 2026 less certain. Nevertheless, most analysts still expect a meaningful reduction in borrowing costs next year. This confidence is partly based on the anticipated replacement of Fed Chair Jerome Powell with White House economic adviser Kevin Hassett, a move that could reduce the central bank’s degree of independence.
By contrast, markets do not expect the European Central Bank (ECB) to adjust policy parameters in the near term. Since last year, the regulator has eased monetary policy eight times, and current conditions are widely viewed as neutral. Moreover, the latest inflation data show that the Consumer Price Index held steady at 2.1% year-on-year in November, signaling stabilization of price pressure near the target level. Under these conditions, an additional reduction in borrowing costs over the medium term appears unlikely.
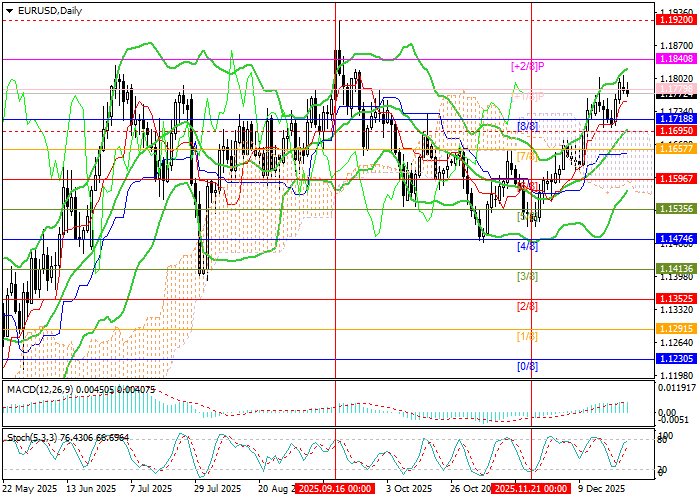
Support and resistance levels
The instrument is testing the 1.1779 level (Murrey [+1/8]). A breakout above this mark would open the way for further growth toward 1.1840 (Murrey [+2/8]) and 1.1920 (the September highs area). If the price consolidates below the Bollinger Bands midline at 1.1695, the decline could extend toward 1.1596 (Murrey [6/8], lower Bollinger Band).
Technical indicators allow for the continuation of the bullish move: Bollinger Bands and the Stochastic oscillator are turning upward, while MACD remains stable in positive territory.
Resistance levels: 1.1779, 1.1840, 1.1920.
Support levels: 1.1695, 1.1596.
Trading scenarios and EUR/USD forecast
Long positions may be opened above 1.1779 with targets at 1.1840 and 1.1920, and a stop-loss at 1.1735. Time horizon: 5–7 days.
Short positions may be opened below 1.1695 with a target at 1.1596 and a stop-loss at 1.1755.
Scenario
| Timeframe | Weekly |
| Recommendation | BUY STOP |
| Entry point | 1.1780 |
| Take Profit | 1.1840, 1.1920 |
| Stop Loss | 1.1735 |
| Key levels | 1.1596, 1.1695, 1.1779, 1.1840, 1.1920 |
Alternative scenario
| Recommendation | SELL STOP |
| Entry point | 1.1690 |
| Take Profit | 1.1596 |
| Stop Loss | 1.1755 |
| Key levels | 1.1596, 1.1695, 1.1779, 1.1840, 1.1920 |