
It should be noted that the likelihood of a dovish shift increased significantly after non-farm payrolls fell to 22.0K and the 12-month figure through early March was revised down by –911.0K.
Meanwhile, in August, Switzerland’s producer and import price index fell from –0.2% to –0.6% month-on-month (analysts had expected 0.1%) and from –0.9% to –1.8% year-on-year. The Swiss National Bank’s (SNB) borrowing rate remains at zero, but previously the regulator’s leadership did not rule out further stimulus measures, including currency interventions or negative rates. At the same time, the country’s largest lender, UBS Group AG, may relocate its headquarters to the US at the request of authorities, who demand the bank raise an additional $26.0 billion in capital to ensure resilience during crises.
Support and resistance levels
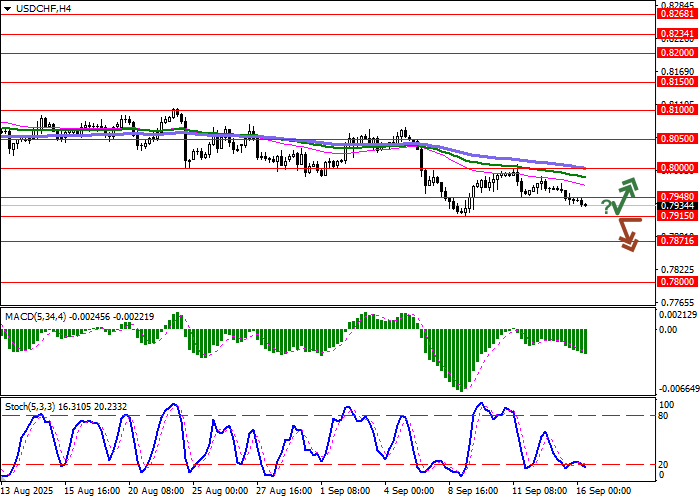
On the daily chart, Bollinger Bands are attempting to flatten: the price range is narrowing while remaining wide enough for current activity. The MACD indicator is declining, maintaining a weak sell signal (the histogram is below the signal line), while the Stochastic has turned downward.
Resistance levels: 0.7948, 0.8000, 0.8050, 0.8100.
Support levels: 0.7915, 0.7871, 0.7800, 0.7750.
Trading scenarios and USD/CHF forecast
Short positions may be opened after a confident breakout below 0.7915 with a target at 0.7800. Stop-loss — 0.7955. Implementation period: 2–3 days.
Long positions may be opened after a rebound from 0.7915 and a breakout above 0.7948 with a target at 0.8050. Stop-loss — 0.7900.
Scenario
| Timeframe | Intraday |
| Recommendations | SELL STOP |
| Entry point | 0.7915 |
| Take Profit | 0.7800 |
| Stop Loss | 0.7955 |
| Key levels | 0.7750, 0.7800, 0.7871, 0.7915, 0.7948, 0.8000, 0.8050, 0.8100 |
Alternative scenario
| Recommendations | BUY STOP |
| Entry point | 0.7950 |
| Take Profit | 0.8050 |
| Stop Loss | 0.7900 |
| Key levels | 0.7750, 0.7800, 0.7871, 0.7915, 0.7948, 0.8000, 0.8050, 0.8100 |
