

Despite Iran being under daily attacks, its retaliatory actions have almost completely halted the supply of oil and liquefied natural gas (LNG) from the region. Mojtaba Khamenei, elected Supreme Leader of the Islamic Republic after the death of his father Ali Khamenei, declared in his first public statement that Iran would respond symmetrically to the United States and Israel and called on Persian Gulf countries to close American military bases. He described the blockade of the Strait of Hormuz — through which around 20.0% of global traffic passed before the operation — as an “important leverage point,” adding that the restrictions would remain in place. During the night of March 12, Iran attacked two tankers using naval drones, and earlier attacks on other civilian vessels had already been reported.
The escalation around this key transport corridor has triggered a global surge in hydrocarbon prices. As a result, representatives of the 32 member countries of the International Energy Agency (IEA) decided on the largest single release of fuel reserves in history, totaling 400.0 million barrels. The agency had taken similar steps three times before, but on a much smaller scale: in 1991 and 2005 the releases amounted to 17.3 million and 20.8 million barrels respectively.
Nevertheless, experts believe the expected release will not be sufficient to compensate for the supply losses and may cover only five to seven days of current consumption levels. Analysts now forecast global demand growth of 644.0 thousand barrels per day, whereas last month they expected an increase of 849.0 thousand barrels per day compared with 2025 levels. Demand forecasts for March and April were revised down by roughly 1.0 million barrels per day due to the consequences of the U.S.–Iran confrontation. According to the agency, oil consumption in OECD countries may decline by 40.0 thousand barrels per day in 2026, while demand in non-OECD countries could increase by 684.0 thousand barrels per day.
Meanwhile, yesterday’s report from the American Petroleum Institute (API) showed a change in crude inventories of –1.700 million barrels following a previous increase of 5.600 million barrels. Data from the U.S. Energy Information Administration (EIA) indicated a build of 3.824 million barrels compared with 3.475 million barrels earlier.
Following the IEA decision, tensions in trading venues have slightly eased. According to statistics from the Chicago Mercantile Exchange (CME Group), on March 11 the number of futures positions reached 1.87 million, the lowest level since the beginning of the month. At the same time, the number of options contracts remains high at 434.0 thousand, only slightly below last week’s peak. Naturally, such growth in trading volumes leads to strong price fluctuations, and if the indicator remains elevated, the price of “black gold” could retest the historical high near 113.0 dollars per barrel.
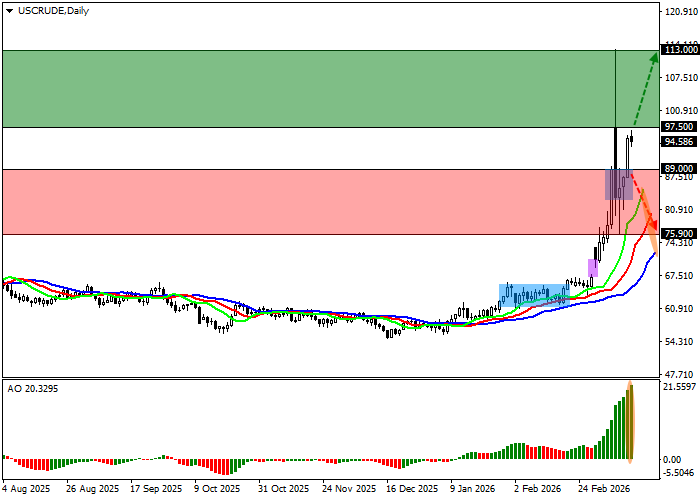
Support and Resistance Levels
On the daily chart, the instrument is correcting above the intermediate support level at 83.00.
Technical indicators maintain a stable buy signal: the fast EMAs of the Alligator indicator remain well above the signal line, while the AO histogram forms corrective bars near the transition level.
Resistance levels: 97.50, 113.00.
Support levels: 89.00, 75.90.
Trading Scenarios and WTI Crude Oil Forecast
Long positions can be opened after the price consolidates above the level of 97.50 with a target at 113.00. Stop loss — 94.00. Implementation period: 7 days or more.
Short positions can be opened after the price consolidates below the level of 89.00 with a target at 75.90. Stop loss — 93.00.
Scenario
| Timeframe | Weekly |
| Recommendation | BUY STOP |
| Entry point | 97.55 |
| Take Profit | 113.00 |
| Stop Loss | 94.00 |
| Key levels | 75.90, 89.00, 97.50, 113.00 |
Alternative Scenario
| Recommendation | SELL STOP |
| Entry point | 88.95 |
| Take Profit | 75.90 |
| Stop Loss | 93.00 |
| Key levels | 75.90, 89.00, 97.50, 113.00 |
