

A second key factor is fuel inventory data. First, the American Petroleum Institute (API) reported a weekly change for April 17 of –4.4 million barrels versus a forecast of –1.0 million, which initially supported higher prices for black gold. However, the official report from the US Energy Information Administration (EIA) showed an increase in inventories of 1.925 million barrels, while analysts had expected a decline of 1.9 million barrels. This points to a less strained supply situation than previously assumed and creates pressure on the instrument. As a result, the official bearish signal was only partially able to offset the impact of actual supply disruptions, since traders are primarily pricing in the risk of a physical supply shortage on the global market rather than a local build in US inventories. As long as the situation in the Persian Gulf remains unstable, EIA data are unlikely to have a major impact on the asset.
In the longer term, prices remain sensitive both to declining supply and to a possible cooling in demand. In 2026, demand is expected to fall by 80.0 thousand barrels per day, whereas a rise had previously been projected. That means the current positive price dynamics are being driven by a geopolitical risk premium rather than by stronger consumption, and once supplies recover, hydrocarbon prices could begin to ease. Meanwhile, during a closed briefing for members of the House Armed Services Committee, the US Department of Defense reportedly said that clearing mines in the Strait of Hormuz could take up to six months, disappointing both Democrats and Republicans. That suggests oil prices could remain elevated for a considerable period even after a peace agreement is reached.
Support and resistance levels
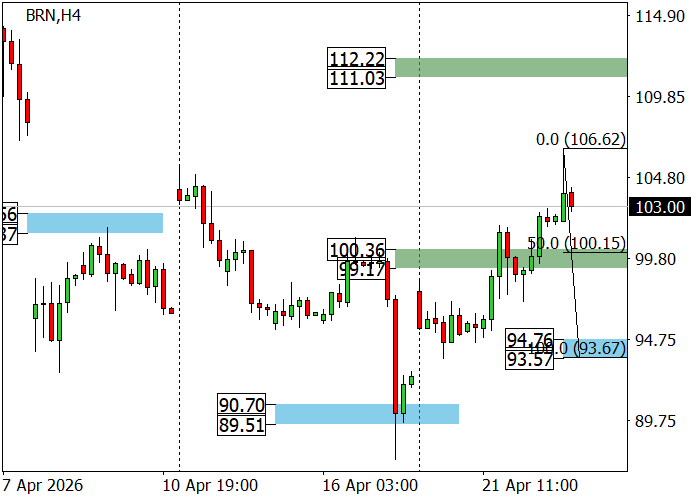
The long-term trend remains bullish, and within that trend the asset has updated the April 13 high of 105.64. A firm break above this level could open the way toward 114.18 and 119.14, the March peak. Otherwise, a correction toward support at 92.67 is expected.
The medium-term trend turned bullish this week as the price broke above the key resistance area of 100.36–99.17 and headed toward Zone 2 at 112.22–111.03. Long positions may be considered on a correction from the support area of 94.76–93.57, with targets at 100.15 and 106.62, the weekly high. However, if the 94.76–93.57 area is broken to the downside, short positions become relevant with a target in the 82.90–81.71 zone.
Resistance levels: 105.64, 114.18, 119.14.
Support levels: 92.67, 87.28, 81.37.
Trading scenarios and Brent Crude Oil forecast
Long positions may be opened above 107.00 with a target at 114.18 and a stop-loss at 104.00. Implementation period: 9–12 days.
Short positions may be opened below 98.50 with a target at 92.67 and a stop-loss at 101.15.
Scenario
| Timeframe | Weekly |
| Recommendation | BUY STOP |
| Entry Point | 107.05 |
| Take Profit | 114.18 |
| Stop Loss | 104.00 |
| Key levels | 81.37, 87.28, 92.67, 105.64, 114.18, 119.14 |
Alternative Scenario
| Recommendation | SELL STOP |
| Entry Point | 98.45 |
| Take Profit | 92.67 |
| Stop Loss | 101.15 |
| Key levels | 81.37, 87.28, 92.67, 105.64, 114.18, 119.14 |
