

The armed confrontation in the Middle East, ongoing since early March and involving Iran, the United States, and Israel, continues to weigh on the global economy. Iran has responded with attacks on US-linked targets in Gulf countries, while disruptions to production and transport capacity initially pushed hydrocarbon prices sharply higher. A second major factor was the blockade of the Strait of Hormuz by Iran’s Islamic Revolutionary Guard Corps (IRGC). Before the crisis, the waterway handled up to 20.0% of global hydrocarbon traffic and as much as 80.0% of shipments to the EU. Tehran has also announced that vessels passing through the area will now face charges of up to $2.0 million per tanker, after which the route’s effective capacity fell close to zero, supporting fuel prices further. In recent weeks, the sides have tried to end the conflict through Pakistan-mediated talks, but so far without success.
Oil prices have now stabilized around 90.00, but that level reflects electronic futures pricing rather than the true cost of physical delivery. In today’s market, paper oil trades below physical oil because it does not include transport and storage costs. Under normal conditions, the gap is usually around $10.0–15.0, but in some regions it has now widened to as much as 100.0%. At the start of the week, Saudi Finance Minister Mohammed Al-Jadaan told reporters that while exchange-traded oil was priced near 90.00, real deliverable futures were being negotiated at 120.00, 130.00, or even 140.00, and in some ports as high as 160.00. This suggests that the situation in the Middle East is likely to fuel a sharp rise in global inflation, especially in countries that depend heavily on imports.
Another sign of market instability is the spread between WTI Crude Oil and Brent Crude Oil, which previously ranged between $2.50 and $3.50. Today, the spread has widened to $5.01, pointing to a high probability that it will eventually narrow again, with the fastest way for that to happen being a parallel rise in both benchmarks.
If we look at investor demand for WTI Crude Oil contracts, trading volumes have remained broadly stable for an extended period. A sharp spike in activity was recorded only on April 8, when the number of contracts jumped to 1.9 million. Since then, interest has eased somewhat, and the figure is now holding steady around 1.1 million. Comparing trading dynamics with the broader market situation suggests that a large share of volume may still consist of hedged positions, where an equal number of buy and sell lots are opened at the same time, temporarily preventing sharper price moves.
Technical indicators continue to support further upside.
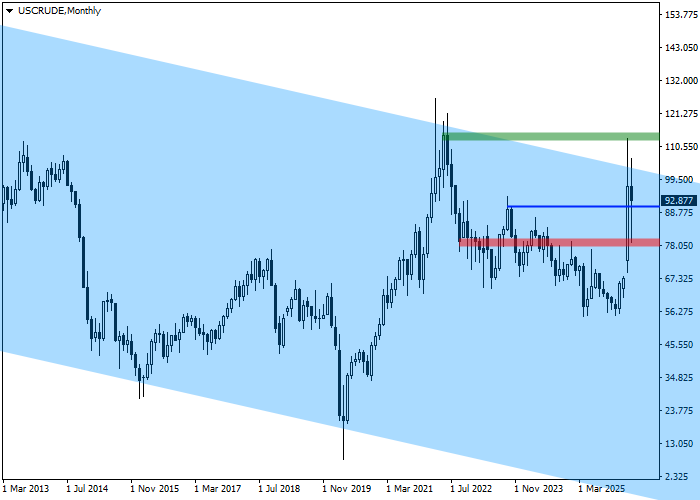
On the monthly chart, prices are moving within a descending channel with dynamic boundaries at 114.00–10.00.

On the weekly chart, after breaking above the 38.2% Fibonacci base correction level at 82.00, the asset has remained above it and has already tested the 61.8% Fibonacci full correction level at 99.00.
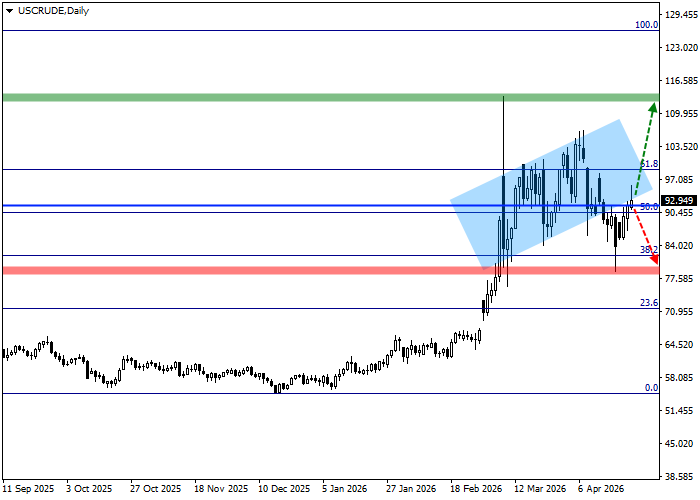
Key levels are best assessed on the daily timeframe.
The trend is developing within an ascending channel with dynamic boundaries at 105.00–90.00, and prices are correcting higher after reaching the support line. If the market reverses and falls toward 79.00, below the 38.2% Fibonacci base correction level, the bullish scenario would either be canceled or significantly delayed, and open long positions should be closed. The target zone is located near 113.00, which coincides with the March 9 high. If price rises into that area, profits on long positions should be taken.
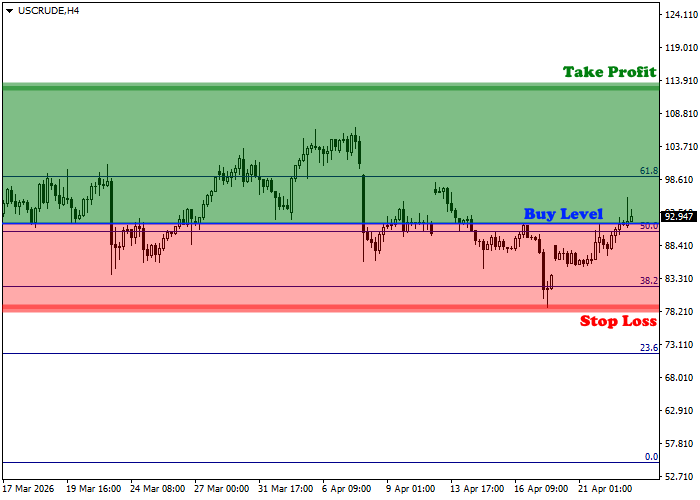
Entry levels can be assessed in more detail on the four-hour chart.
The entry point for long positions is located at 91.80, and the signal to open positions was already received this week after the price consolidated above the intermediate high. A further advance is expected once the market breaks above the 61.8% Fibonacci full correction level at 99.00.
Given that the instrument’s average daily volatility over the past month has increased to 1,127.0 points, a move toward the 99.00 target zone could take around 49 trading sessions, although if volatility rises further, that timeframe could be reduced to 27 days.
