
Diplomatic sources claim that Tehran has put forward several tough conditions for the start of negotiations, including the payment of reparations. The rhetoric from the White House does not imply such measures, prompting analysts to revise their estimates regarding the duration of the Middle East conflict. This situation continues to support hydrocarbon prices and increases the risk of accelerating global inflation.
In February, the US Consumer Price Index rose from 0.2% to 0.3% month-over-month and remained at 2.4% year-over-year. The core CPI slowed from 0.3% to 0.2% month-over-month but stayed at 2.5% annually, remaining above the Federal Reserve’s target. Average gasoline prices in the US climbed to $3.598 per gallon as of Thursday, compared with $3.250 a week earlier and $2.940 a month ago, according to the non-profit American Automobile Association.
In an interview with WCNC, Donald Trump suggested that part of the strategic oil reserves could be used to reduce fuel prices, noting that he had previously managed to replenish reserves and could do so again. However, analysts emphasize that the latest inflation data only reflects the period before the escalation in the Persian Gulf region. In the first 12 days of March alone, gasoline prices increased by about 20.0%, which may accelerate inflation by at least 1.0% by the end of the month. Under such conditions, the Federal Reserve may adopt a wait-and-see approach to monetary policy.
Analysts at The Goldman Sachs Group Inc. now expect interest rate cuts to begin in September and December rather than in June and September as previously forecast, which strengthens the position of the US dollar.
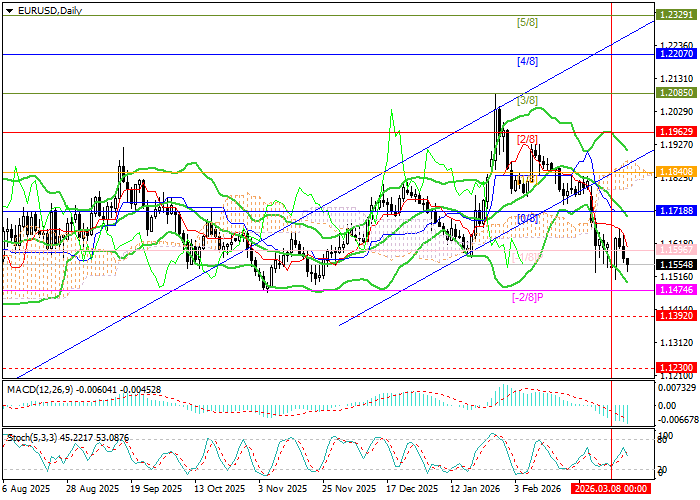
Support and resistance levels
The instrument has consolidated below the 1.1596 mark (Murray level [–1/8]) and may reach the August low at 1.1392 and 1.1230 (Murray level [6/8], W1). However, if the price breaks back above the middle Bollinger Band at 1.1718 (Murray level [0/8]), growth toward 1.1962 (Murray level [2/8]) and 1.2207 (Murray level [4/8]) could resume.
Technical indicators suggest the formation of a downward trend: Bollinger Bands and the Stochastic oscillator are turning downward, while the MACD histogram is expanding in the negative zone.
Resistance levels: 1.1718, 1.1962, 1.2207.
Support levels: 1.1392, 1.1230.
Trading scenarios and EUR/USD forecast
Short positions can be opened from the 1.1530 level with targets at 1.1392 and 1.1230 and a stop-loss at 1.1620. Implementation period: 5–7 days.
Long positions can be opened above the 1.1718 level with targets at 1.1962 and 1.2207 and a stop-loss at 1.1580.
Scenario
| Timeframe | Weekly |
| Recommendation | SELL STOP |
| Entry Point | 1.1525 |
| Take Profit | 1.1392, 1.1230 |
| Stop Loss | 1.1620 |
| Key levels | 1.1230, 1.1392, 1.1718, 1.1962, 1.2207 |
Alternative scenario
| Recommendation | BUY STOP |
| Entry Point | 1.1720 |
| Take Profit | 1.1962, 1.2207 |
| Stop Loss | 1.1580 |
| Key levels | 1.1230, 1.1392, 1.1718, 1.1962, 1.2207 |
