
The main pressure on the euro remains the situation in the Middle East, which has significantly affected hydrocarbon supplies to the global market. After the sharp reduction of pipeline deliveries of liquefied natural gas (LNG) from Russia in 2022–2023, LNG’s role in the region’s energy balance increased substantially. In 2023, EU countries imported around 135.0B cubic meters of LNG, accounting for about 40–45% of the total supply. The main suppliers were Qatar, Norway, and the United States, with the latter accounting for more than 45% of all LNG shipments to European terminals. Under such dependence, any disruptions in major LNG production or export facilities quickly affect price dynamics and consequently put pressure on the euro.
However, the sector stabilized somewhat this week following statements from the International Energy Agency (IEA) about the readiness of major oil-consuming countries to use strategic reserves to offset possible supply shortages. According to the agency, fuel reserves created within the global energy security system established after the oil crisis of the 1970s exceed 1.2–1.5B barrels, and when combined with mandatory reserves held by commercial oil companies, they could reach about 2.0B barrels. IEA rules require member countries to maintain reserves equal to at least 90 days of net imports, providing a significant buffer against short-term supply disruptions. Preliminary estimates suggest that a coordinated release could amount to 300–400M barrels, equivalent to around 25–30% of strategic reserves controlled by IEA members, potentially offsetting a significant portion of market shortages, particularly if they prove temporary.
The US dollar, which largely determines the pair’s movement, is currently trading near 98.70 on the USDX and may continue the local downward trend seen this week. As markets currently lack sufficient liquidity to support both rising oil prices and a stronger dollar simultaneously, pressure on the currency may persist until investors return to large-scale dollar operations. As for macroeconomic statistics, February data on existing home sales released yesterday showed an increase from 4.02M units to 4.09M units, which is 1.7% higher than the previous month.
Support and resistance levels
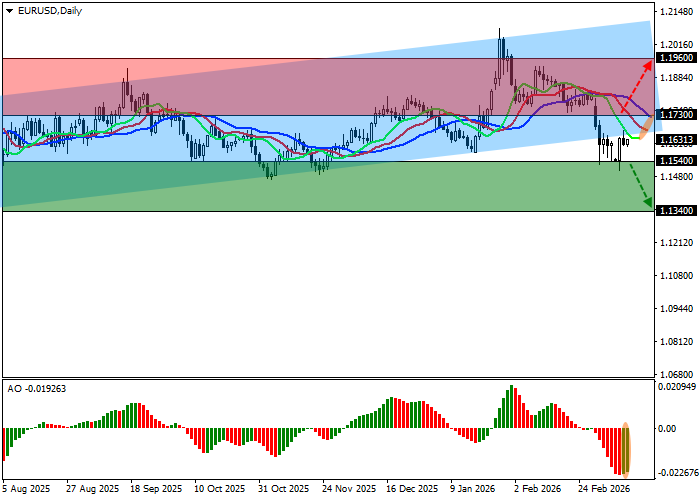
On the daily chart, the trading instrument remains below the support line of the ascending channel with boundaries at 1.2120–1.1650.
Technical indicators reinforce the sell signal received at the beginning of last week. The fast EMAs of the Alligator indicator are positioned below the signal line and are widening their range, while the AO histogram is forming corrective bars and moving deeper into the selling zone.
Resistance levels: 1.1730, 1.1960.
Support levels: 1.1540, 1.1340.
Trading scenarios and EUR/USD forecast
Short positions may be opened after a decline and consolidation below the level of 1.1540 with a target at 1.1340. Stop-loss — 1.1620. Implementation period: 7 days or more.
Long positions may be opened after growth and consolidation above the level of 1.1730 with a target at 1.1960. Stop-loss — 1.1620.
Scenario
| Timeframe | Weekly |
| Recommendation | SELL STOP |
| Entry Point | 1.1535 |
| Take Profit | 1.1340 |
| Stop Loss | 1.1620 |
| Key levels | 1.1340, 1.1540, 1.1730, 1.1960 |
Alternative scenario
| Recommendation | BUY STOP |
| Entry Point | 1.1735 |
| Take Profit | 1.1960 |
| Stop Loss | 1.1620 |
| Key levels | 1.1340, 1.1540, 1.1730, 1.1960 |
