

Earlier this week, the benchmark Brent Crude Oil price surged by nearly 30%, reaching an intraday high of $119–$120 per barrel, the highest level since 2022. Prices later retreated to the $94–$96 range, highlighting extreme volatility in the energy market. Such rapid movements in oil prices have already pushed the average retail gasoline price in the United States to $3.34–$3.50 per gallon, while in California—where fuel prices are traditionally the highest in the country—the price reached $5.2, surpassing the previous April peak of $5.0. Analysts believe that if the Strait of Hormuz remains blocked for a prolonged period, gasoline prices could rise further toward $4.12 nationwide, putting additional pressure on household consumer spending.
At the same time, the US dollar, traditionally considered a safe-haven asset, is losing part of its defensive appeal amid the growing commodity shock and rising inflation expectations. This is reflected in widening yield spreads and the increasing correlation between oil prices and movements in currency markets.
Regarding interest rate dynamics, the ongoing Middle East crisis has slightly adjusted market expectations regarding the Federal Reserve’s future monetary policy. A hawkish stance is now increasingly viewed as potentially destabilizing, capable of further increasing volatility and suppressing already slowing consumer and corporate demand. According to the CME FedWatch Tool, the probability that borrowing costs will remain within the 3.50–3.75% range at the next Federal Reserve meeting on March 18 is estimated at 99.4%. This reflects a consensus among market participants that a pause in monetary policy adjustments is necessary amid moderate employment growth, continued consumer spending, and the need for the Fed to balance inflation control with support for economic activity.
The main phase of corporate earnings releases has already ended, while bond yields continue to rise. The benchmark 10-year US Treasury yield currently stands at 4.143%, slightly below the 4.146% level recorded at the end of last week. Meanwhile, 20-year and 30-year bonds are yielding 4.747% and 4.784%, compared with 4.714% and 4.730% respectively at the end of the previous week.
Among the top gainers within the index are 3M Co. (+2.39%), Cisco Systems Inc. (+1.96%), Caterpillar Inc. (+1.68%), and Honeywell International Inc. (+1.27%).
The biggest losers include The Boeing Co. (–3.22%), Salesforce Inc. (–1.95%), Chevron Corp. (–1.66%), and IBM Corp. (–1.24%).
Support and resistance levels
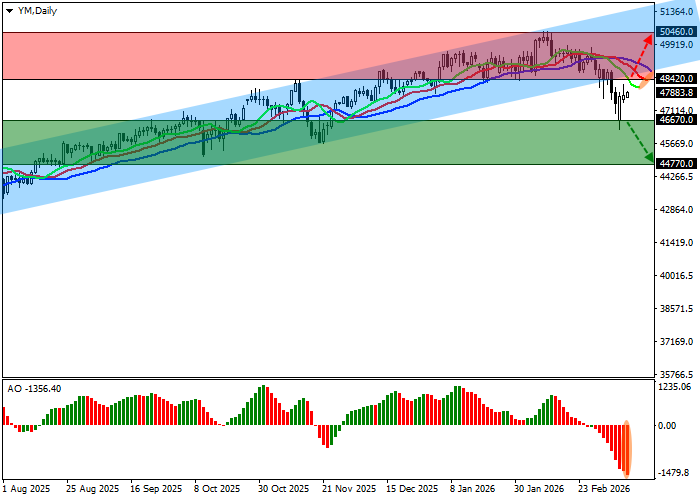
On the daily chart, the instrument is declining again after an unsuccessful attempt to break back above the support line of the ascending channel with boundaries at 50,700.0–48,400.0.
Technical indicators maintain a stable sell signal. The EMA range of the Alligator indicator remains wide, while the AO histogram forms corrective bars below the zero line.
Support levels: 46,670.0, 44,770.0.
Resistance levels: 48,420.0, 50,460.0.
Trading scenarios and DJIA forecast
Short positions may be opened after the price consolidates below the 46,670.0 level with a target at 44,770.0. Stop-loss — 47,300.0. Implementation period: 7 days or more.
Long positions may be opened after the price consolidates above the 48,420.0 level with a target at 50,460.0 and a stop-loss at 47,900.0.
Scenario
| Timeframe | Weekly |
| Recommendation | SELL STOP |
| Entry Point | 46,669.5 |
| Take Profit | 44,770.0 |
| Stop Loss | 47,300.0 |
| Key levels | 44,770.0, 46,670.0, 48,420.0, 50,460.0 |
Alternative scenario
| Recommendation | BUY STOP |
| Entry Point | 48,420.5 |
| Take Profit | 50,460.0 |
| Stop Loss | 47,900.0 |
| Key levels | 44,770.0, 46,670.0, 48,420.0, 50,460.0 |
