

The company continues to strengthen its position in the high-performance computing and advanced software markets, reinforcing its strategic focus on supercomputer development. As part of this strategy, management recently announced a five-year partnership with Lam Research Corp., one of the world’s leading manufacturers of semiconductor fabrication equipment. The collaboration aims to design next-generation processors and specialized materials capable of enabling transistor scaling below one nanometer. Against this backdrop, analysts at BofA Securities reiterated their “buy” rating on the company’s shares with a target price of 340.00, while UBS upgraded its rating from “sell” to “neutral,” citing a more balanced risk outlook that could allow the stock to remain above the 236.0 level.
In mid-April, the company is expected to release its first-quarter financial results. According to analysts’ estimates, revenue may reach $15.58 billion. While this figure would remain below the previously reported $19.7 billion, it still represents an improvement compared to $14.54 billion recorded a year earlier. Earnings per share are projected to reach $1.87, compared with $4.52 in the previous quarter and $1.60 in the same period last year. In addition, the company recently completed its latest dividend payment of $1.68 per share, marking the final distribution in the annual cycle. The dividend yield stood at approximately 2.27%, significantly higher than the sector average of about 0.65% annually.
Support and resistance levels
On the daily chart, the instrument is undergoing a correction while remaining slightly above the key support level of 240.00.
Technical indicators currently show an unstable sell signal that is gradually weakening. The EMA range of the Alligator indicator is narrowing, while the Awesome Oscillator histogram is forming corrective bars slightly below the zero line.
Support levels: 239.00, 213.00.
Resistance levels: 260.00, 285.00.
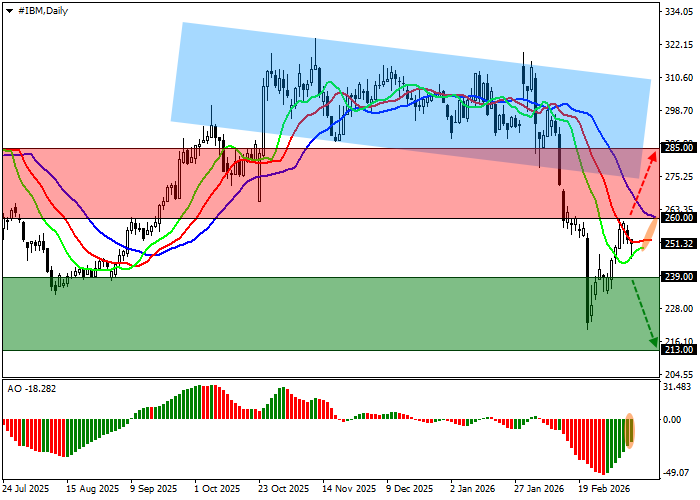
Trading scenarios and IBM Corp forecast
Short positions may be opened after a decline and consolidation below the 239.00 level with a target at 213.00 and a stop-loss at 248.00. Implementation period: 7 days or more.
Long positions may be opened after consolidation above the 260.00 level with a target at 285.00 and a stop-loss at 250.00.
Scenario
| Timeframe | Weekly |
| Recommendation | SELL STOP |
| Entry Point | 238.95 |
| Take Profit | 213.00 |
| Stop Loss | 248.00 |
| Key levels | 213.00, 239.00, 260.00, 285.00 |
Alternative scenario
| Recommendation | BUY STOP |
| Entry Point | 260.05 |
| Take Profit | 285.00 |
| Stop Loss | 250.00 |
| Key levels | 213.00, 239.00, 260.00, 285.00 |
