

Hyperliquid (HYPE) is currently among the strongest performers in the cryptocurrency market. The decentralized perpetual futures exchange benefits from rising trading volumes in contracts tied to assets such as gold, silver, and oil. The ability to trade 24 hours a day — especially during weekends — has triggered a sharp increase in investor demand and significantly boosted the project’s fee revenue. These factors support the HYPE price and reinforce bullish expectations in the market.
Blockchain Innovation as a Growth Driver
Over the past 30 trading days, bulls have maintained full control of the market, pushing the HYPE price up by roughly 25%. Investors appear to be increasingly pricing in the project’s tokenomics. Following the introduction of the HIP-3 upgrade, which enables trading of tokenized traditional assets as perpetual contracts, the platform secured an additional revenue stream.
For every new HIP-3 asset added, 500,000 HYPE tokens are locked, effectively reducing the circulating supply of the cryptocurrency. In addition, around 97% of fee revenue is used for token buybacks followed by token burns. This further decreases supply and increases token scarcity within the market.
Trading volume for oil perpetual contracts alone on Hyperliquid exceeded 5 billion dollars within just a few days amid tensions surrounding the Iran conflict. Both retail traders and Wall Street participants used the platform over the weekend, further accelerating the token’s supply reduction.
Through the HIP-4 proposal, the ecosystem is also seeking to compete with prediction platforms such as Polymarket and Kalshi. Recently, trading volume on Hyperliquid surpassed that of centralized exchange Coinbase, solidifying its position as the largest perpetual DEX. These technological developments have increasingly supported the HYPE price. From its yearly low of 20.48$, the token has already gained approximately 82%.
Key Levels for the Coming Trading Sessions
If the HYPE price manages to hold above the current resistance zone and break the previous month’s high at 38.42$, the next likely target would be around 40.03$. If buyers remain in control and Bitcoin also breaks out of its current consolidation range, the probability of further upside will increase significantly.
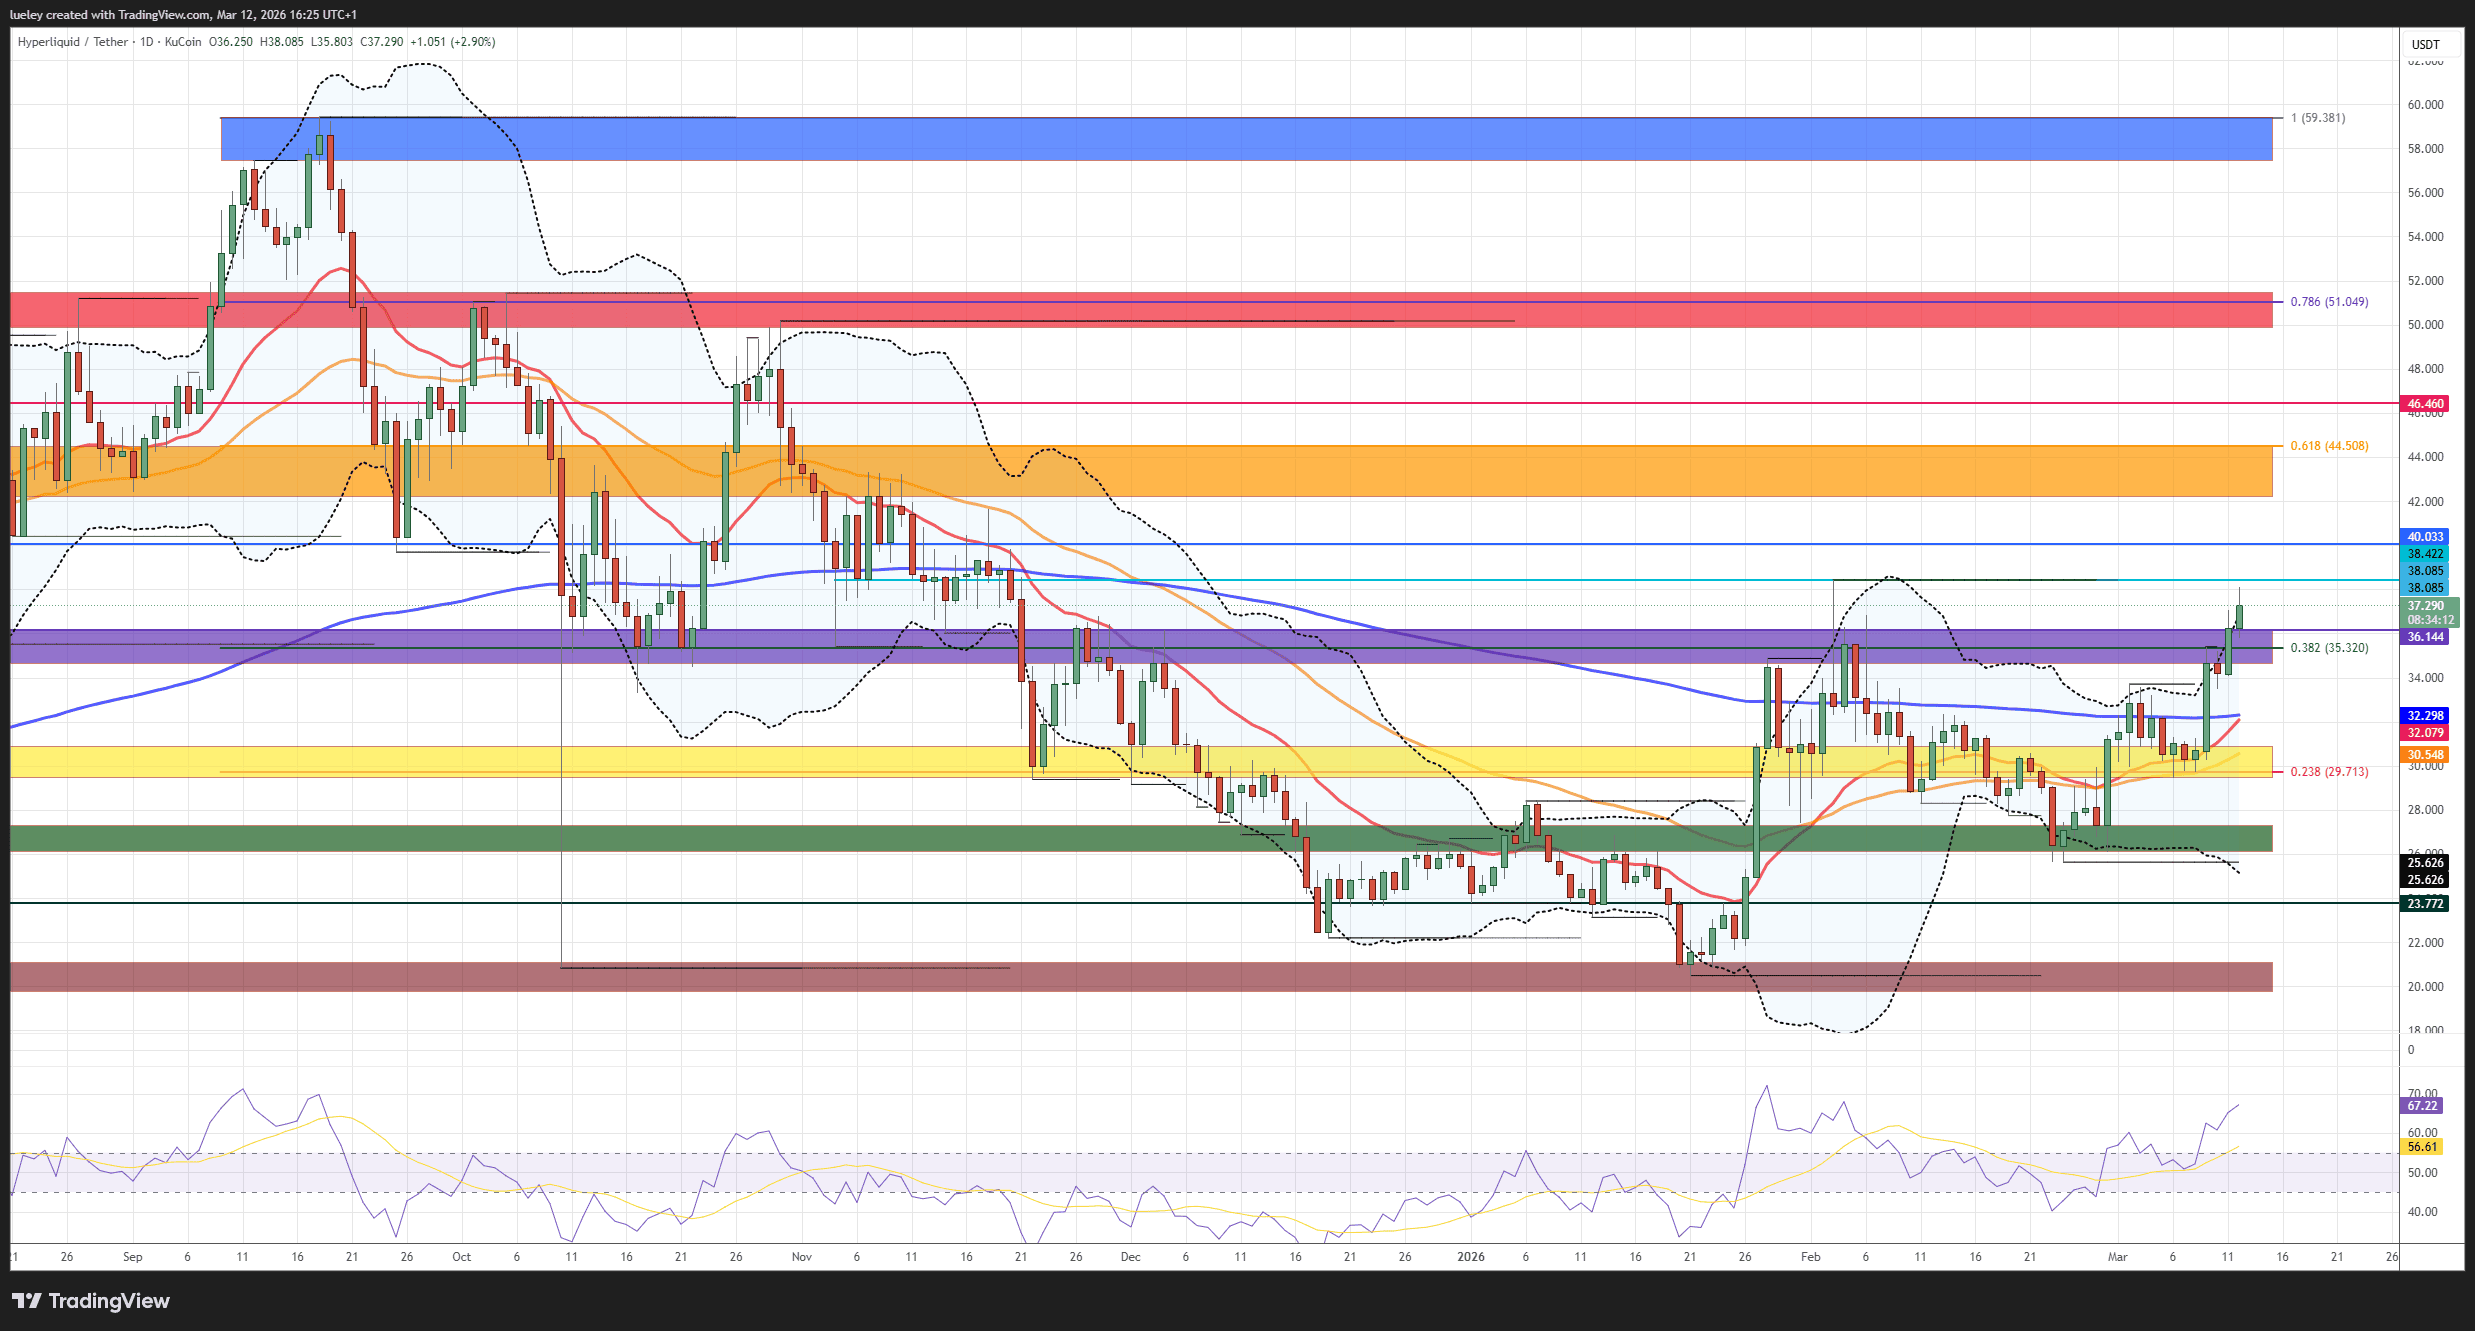
However, if Hyperliquid falls below the 38% Fibonacci retracement at 35.32$ amid a correction in the U.S. stock market, a retest of the support area around 32.30$ could follow. This level coincides with the 200-day moving average (EMA200) and the EMA20.
Bullish Scenario for the Coming Weeks
Bullish targets: 38.42$, 40.03$, 42.24–44.50$, 46.46$, 49.87–51.48$, 57.45–59.42$.
Over the past week, the HYPE price climbed about 18%, approaching the upper boundary of the resistance zone near 36.14$. If the price stabilizes above this level, the market could quickly retest last month’s high. A breakout above that resistance would open the path toward the next target at 40.03$.
If the broader crypto market continues to strengthen, the price may move into the 42.24–44.50$ range, where profit-taking activity is likely. This area has repeatedly acted as a major turning point in 2025 and aligns with the important technical Golden Pocket level.
A short-term consolidation would not be problematic. The RSI currently sits near 68, signaling strong but not yet overheated market conditions. If the price stabilizes above 38.42$ and breaks the 61% Fibonacci retracement, the next target would be around 46.46$.
Further upside could drive the price toward the 49.87–51.48$ zone, where strong resistance previously formed. The 78% Fibonacci retracement near 51.05$ also lies in this region, making a pullback likely on the first attempt.
Medium-Term Price Target
If the crypto market recovery gains momentum and Hyperliquid successfully breaks the resistance zone around 50$, the next target would be the area near the all-time high recorded in September 2025. The range between 57.45$ and 59.42$ is currently considered the maximum upside target, representing potential growth of nearly 60% from current levels.
Bearish Scenario
Bearish targets: 36.14–34.66$, 32.29$, 30.89–29.48$, 27.33–26.12$, 23.77$, 21.09–19.77$.
Despite the positive news flow surrounding the project’s development, the first signs of trend exhaustion are beginning to appear. On the hourly chart, bearish divergences are forming, which may signal the possibility of a short-term correction.
The first signal of a decline would be a drop below the 38% Fibonacci retracement along with a break below the support zone. A daily close below 34.66$ would activate the 200-day moving average near 32.29$ as the next target.
If this support level also fails, the probability of a decline toward the 30.89–29.48$ range increases significantly. This zone combines several important technical supports, including the 50-day moving average (EMA50), the monthly low, and the 23% Fibonacci retracement.
Should the market weaken further, the price could fall toward the 27.33–26.12$ area, which previously served as a key battleground between buyers and sellers in 2025. In the event of a deeper correction across the crypto market, a return to 23.77$ or even the 21.09–19.77$ range cannot be ruled out. For now, this area represents the extreme downside scenario.
Indicators
The RSI indicator on shorter timeframes shows early signs of bearish divergence, increasing the likelihood of short-term consolidation. However, on the daily chart RSI remains around 67, confirming the strength of the current uptrend and leaving room for further gains. On the weekly chart, the indicator is also close to generating a fresh buy signal, which supports the case for continued upward momentum.
