

US Treasury Secretary Scott Bessent said yesterday that senators were close to approving the bill. According to sources cited by the CoinDesk analytics platform, negotiations are indeed continuing, although several disputed issues remain unresolved. The key disagreement concerns which authorities should enforce the ban on government officials maintaining ties with the cryptocurrency industry. Democratic Party representatives believe that state attorneys general should be responsible, while the White House and the Republican Party prefer enforcement of the CLARITY Act’s ethics provisions to be handled by the US attorney general, who is nominated directly by the president, raising concerns about the independence of such decisions. No compromise has yet been reached. Nevertheless, the prospect of a clearer regulatory framework being adopted soon is supporting prices of major tokens and shares of crypto-related companies. The bill is expected to be considered no later than August 7, before the Senate begins its recess. Additional support for the digital asset sector comes from slowing growth in shares of semiconductor and artificial intelligence companies. Many observers believe that fading enthusiasm for AI-related assets could encourage investors to reallocate capital toward the cryptocurrency market.
Interest in SOL is also increasing following Grayscale Investments LLC’s decision to introduce regular cash distributions to clients using income generated from Ethereum and Solana staking. The company filed a Form 8-K with the US Securities and Exchange Commission (SEC) and is awaiting regulatory approval for the initiative.
The positive momentum may prove unsustainable due to the risk of tighter monetary policy from the US Federal Reserve. Although inflation slowed in June, it remains above the regulator’s 2.0% target, while rising geopolitical tensions in the Persian Gulf region create the risk of renewed price pressure. Overall market sentiment also remains negative, as reflected by the Crypto Fear and Greed Index, which remains in the “fear” zone at 33.
Support and resistance levels
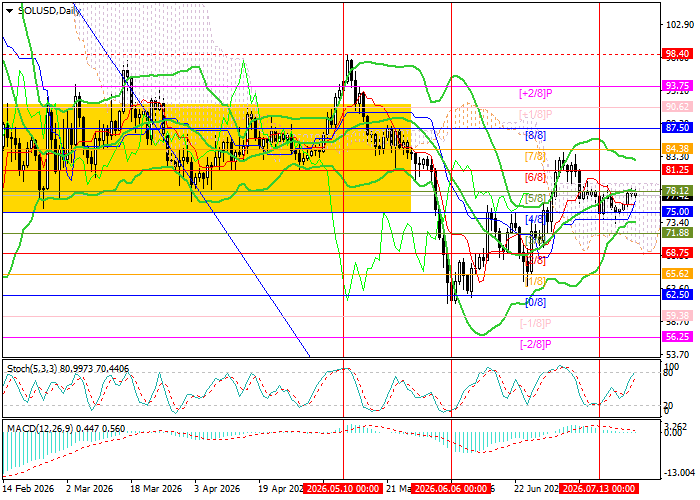
The trading instrument has been forming an upward trend since the beginning of last month and is currently testing the middle line of the Bollinger Bands at 78.12 (Murrey level [5/8]). A confirmed breakout above this level could lead to further growth toward 87.50 (Murrey level [8/8]), 93.75 (Murrey level [+2/8]) and 98.40, the area of three-month highs. However, a breakdown below 75.00 (Murrey level [4/8]) could signal a trend reversal and a decline toward 68.75 (Murrey level [2/8]), 62.50 (Murrey level [0/8]) and 56.25 (Murrey level [–2/8]).
Technical indicators continue to generate a buy signal: the Bollinger Bands are moving upwards, the MACD histogram remains stable in positive territory, while the Stochastic Oscillator has entered the overbought zone, suggesting that a limited correction remains possible.
Resistance levels: 78.12, 87.50, 93.75, 98.40.
Support levels: 75.00, 68.75, 62.50, 56.25.
SOL/USD Trading Scenarios and Price Forecast
Long positions may be opened above 78.12 with targets at 87.50, 93.75 and 98.40 and a stop-loss near 74.00. Time frame: 5–7 days.
Short positions may be opened below 75.00 with targets at 68.75, 62.50 and 56.25 and a stop-loss at 79.00.
Scenario
| Time frame | Weekly |
| Recommendation | BUY STOP |
| Entry point | 78.50 |
| Take Profit | 87.50, 93.75, 98.40 |
| Stop Loss | 74.00 |
| Key levels | 56.25, 62.50, 68.75, 75.00, 78.12, 87.50, 93.75, 98.40 |
Alternative scenario
| Recommendation | SELL STOP |
| Entry point | 74.95 |
| Take Profit | 68.75, 62.50, 56.25 |
| Stop Loss | 79.00 |
| Key levels | 56.25, 62.50, 68.75, 75.00, 78.12, 87.50, 93.75, 98.40 |
