

These comments supported risk assets, including digital currencies, although investor optimism remains cautious, as the rhetoric does not address the possibility of further escalation and does not imply a peace agreement with Tehran or the reopening of the Strait of Hormuz. Additional support for prices came from Federal Reserve Chair Jerome Powell, who stated that there is no immediate need to raise interest rates as inflation expectations remain stable. Following these remarks, the probability of monetary tightening this year dropped from 50.0% to 2.0%, putting pressure on the US dollar.
A positive development for SOL came from the Solana Foundation’s plans to launch a new developer platform designed to simplify the creation of financial products on the blockchain. Among the first users are major payment companies such as Mastercard Inc., The Western Union Co., and Worldpay Inc. The platform is currently in testing and includes a set of tools allowing companies to build financial applications on Solana without deep knowledge of crypto infrastructure, using AI-based tools such as Claude Code by Anthropic PBC and Codex by OpenAI Inc. The platform currently includes an “issuance module” for tokenized deposits and stablecoins, as well as a “payments module” supporting fiat and stablecoin transactions, while a “trading module” is expected later this year. The launch could increase investor interest in both the Solana blockchain and the SOL token.
Despite several positive factors, overall sentiment in the cryptocurrency market remains cautious, as reflected by the Crypto Fear & Greed Index, which remains in the “extreme fear” zone at a reading of 8.
Support and resistance levels
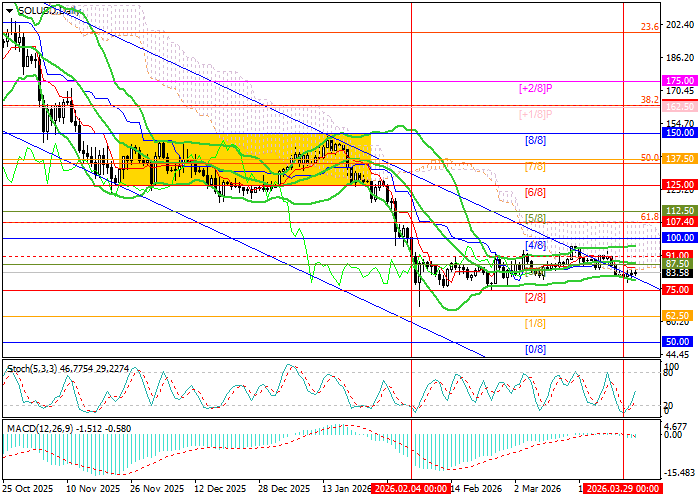
The instrument is trading within the sideways range of 91.00–75.00, awaiting new drivers for further movement. A breakout above 100.00 (Murray [4/8]) would signal a reversal of the long-term downtrend and open the way toward 125.00 (Murray [6/8]) and 137.50 (Murray [7/8], Fibonacci 50.0%). Conversely, a break below the lower boundary at 75.00 (Murray [2/8]) could lead to a decline toward 62.50 (Murray [1/8]) and 50.00 (Murray [0/8]).
Technical indicators provide mixed signals: Bollinger Bands remain horizontal, the MACD histogram is near the zero line with low volumes, and Stochastic is turning upward from the oversold zone. On the weekly chart, however, Bollinger Bands remain downward, while a “flag” pattern is forming, suggesting a higher probability of negative dynamics in the medium term.
Resistance levels: 100.00, 125.00, 137.50.
Support levels: 75.00, 62.50, 50.00.
Trading scenarios and SOL/USD outlook
Short positions can be opened below 75.00 with targets at 62.50 and 50.00 and a stop-loss at 84.50. Implementation period: 5–7 days.
Long positions can be opened above 100.00 with targets at 125.00 and 137.50 and a stop-loss at 91.00.
Scenario
| Timeframe | Weekly |
| Recommendation | SELL STOP |
| Entry point | 74.20 |
| Take Profit | 62.50, 50.00 |
| Stop Loss | 84.50 |
| Key levels | 50.00, 62.50, 75.00, 100.00, 125.00, 137.50 |
Alternative scenario
| Recommendation | BUY STOP |
| Entry point | 100.50 |
| Take Profit | 125.00, 137.50 |
| Stop Loss | 91.00 |
| Key levels | 50.00, 62.50, 75.00, 100.00, 125.00, 137.50 |
