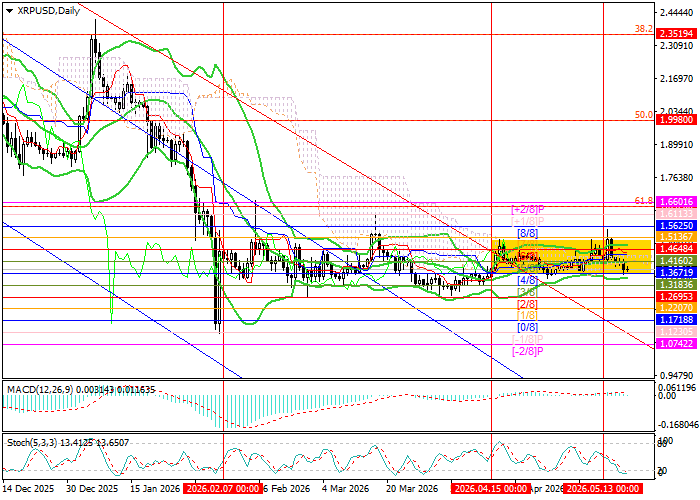
Against a backdrop of escalating rhetoric from parties to the Middle East crisis and mixed signals from central banks regarding their next monetary policy steps, XRP/USD has remained locked in a narrow sideways range of 1.3671–1.5136 (Murray levels [4/8]–[7/8]) for the sixth consecutive week. Last week price tested the upper boundary of the range but failed to hold above it and pulled back toward 1.5136. A confirmed close below 1.3671 (Murray level [4/8], lower Bollinger Band) would trigger a bearish impulse and open the way toward 1.2695 (Murray level [2/8]), 1.1718 (Murray level [0/8]), and 1.0742 (Murray level [–2/8]), while a breakout above 1.5625 (Murray level [8/8]) — which coincides with the Bollinger Bands middle line on the weekly chart — would allow the pair to exit the descending channel, reverse the current trend, and advance toward 1.9980 (Fibonacci retracement 50.0%) and 2.3519 (Fibonacci retracement 38.2%).
Technical indicators are sending mixed signals, reflecting the persistent uncertainty in the market: the Bollinger Bands are moving horizontally, the MACD histogram is hovering near the zero line with minimal volume, while the Stochastic has entered oversold territory and may reverse in the near term. It is also worth noting that on the weekly chart the Bollinger Bands continue to point downward, confirming that the long-term downtrend remains intact — though a reversal cannot be ruled out, as price is preparing to challenge the Bollinger Bands middle line at 1.5625 (Murray level [4/8], W1).
Support and Resistance Levels
Resistance levels: 1.5625, 1.9980, 2.3519.
Support levels: 1.3671, 1.2695, 1.1718, 1.0742.
XRP/USD Trading Scenarios and Price Forecast
Long positions can be opened above 1.5625, targeting 1.9980 and 2.3519, with a stop-loss at 1.4160. Time horizon: 5–7 days.
Short positions should be considered below 1.3671, targeting 1.2695, 1.1718, and 1.0742, with a stop-loss at 1.4420.
| Scenario |
| Timeframe |
Weekly |
| Recommendation |
BUY STOP |
| Entry Point |
1.5640 |
| Take Profit |
1.9980, 2.3519 |
| Stop Loss |
1.4160 |
| Key Levels |
1.0742, 1.1718, 1.2695, 1.3671, 1.5625, 1.9980, 2.3519 |
| Alternative Scenario |
| Recommendation |
SELL STOP |
| Entry Point |
1.3665 |
| Take Profit |
1.2695, 1.1718, 1.0742 |
| Stop Loss |
1.4420 |
| Key Levels |
1.0742, 1.1718, 1.2695, 1.3671, 1.5625, 1.9980, 2.3519 |
John Isige is an experienced cryptocurrency journalist and market analyst specializing in digital assets, blockchain innovation, and emerging Web3 trends. He provides clear, actionable market insights for traders and investors, with particular expertise in DeFi, smart contracts, NFTs, RWAs, and AI-powered blockchain ecosystems. His commentary and analysis have been featured in FORECK.INFO, CoinGape, CryptoNews, and other leading digital finance publications


