Ethereum's staking exit queue increased more than fivefold in just three days, reaching a peak of around 851,000 ETH after MetaMask began proactively withdrawing thousands of validators following a security incident.
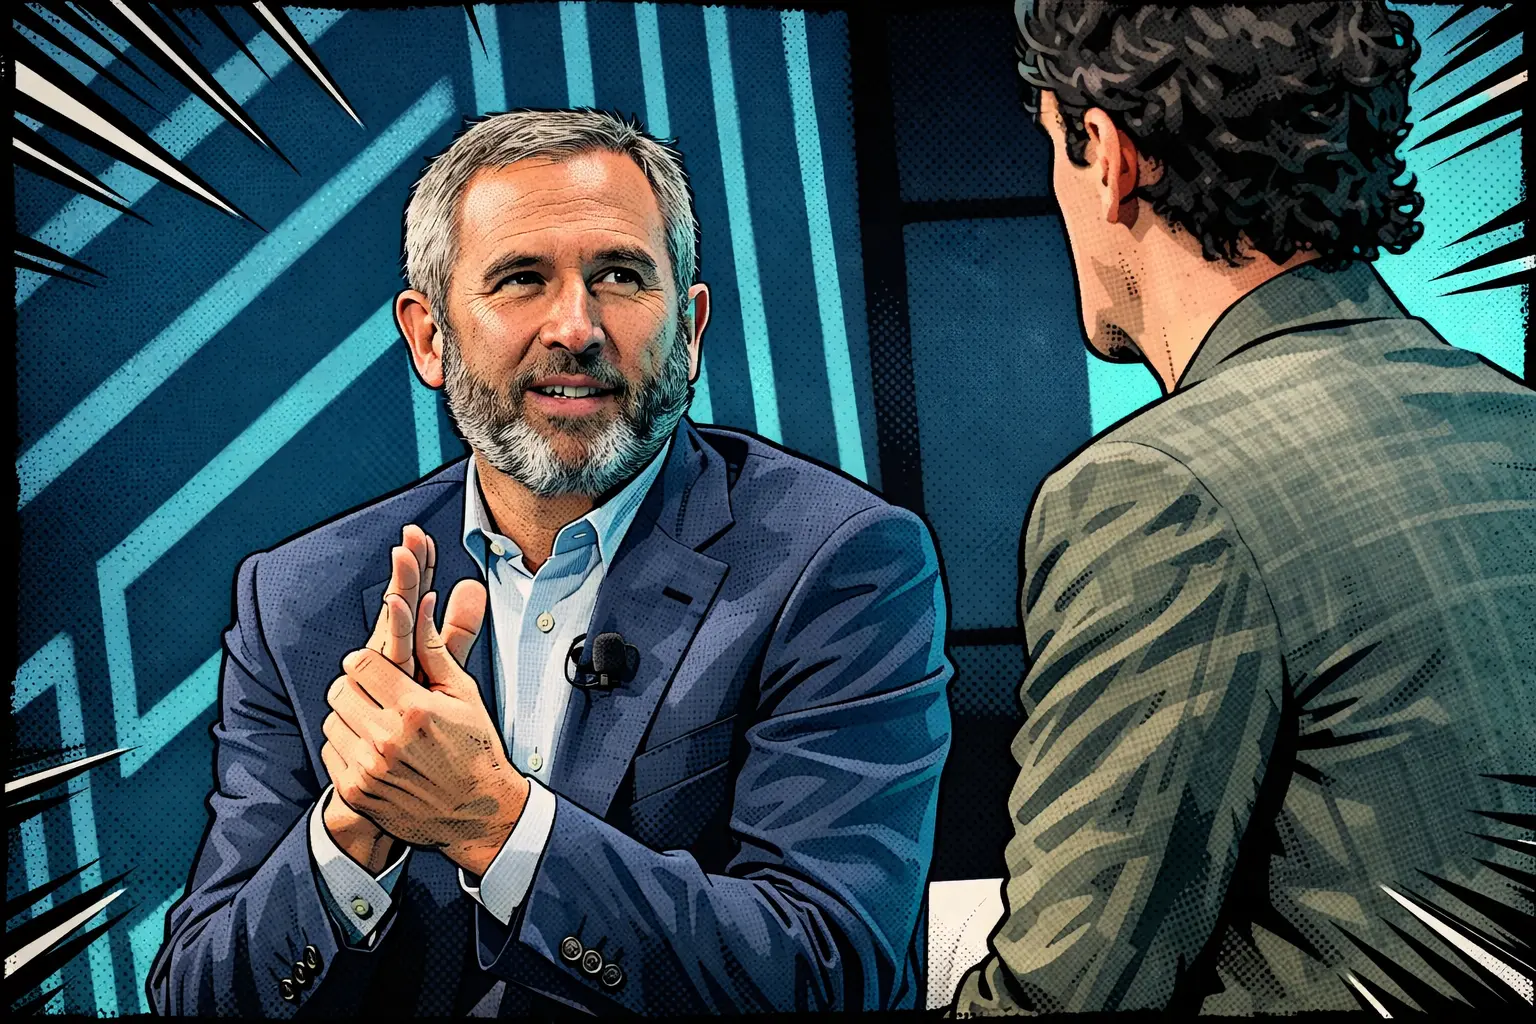
Ripple CEO Brad Garlinghouse said he had a private meeting with former U.S. Securities and Exchange Commission (SEC) Chair Gary Gensler, which, according to Garlinghouse, took place at the White House. During the conversation, Gensler allegedly apologized for his stance on XRP, saying: “I’m sorry, I was wrong.”
The SOL/USD pair has exited a descending channel and entered a 91.00–75.00 range (the upper and lower boundaries of the Bollinger Bands), where it has remained for a third consecutive week. The day before, the instrument once again tested the upper boundary of this range but failed to break higher.
During the current week, the XRP/USD pair is showing a moderate decline in line with the broader market trend and is now trading near 1.3671 (Murray level [3/8]), a level below which it has so far failed to consolidate.
Ethereum co-founder Vitalik Buterin sold ether worth around $43 million in February, as the asset’s price continued to decline. This is evidenced by data from Arkham Intelligence.
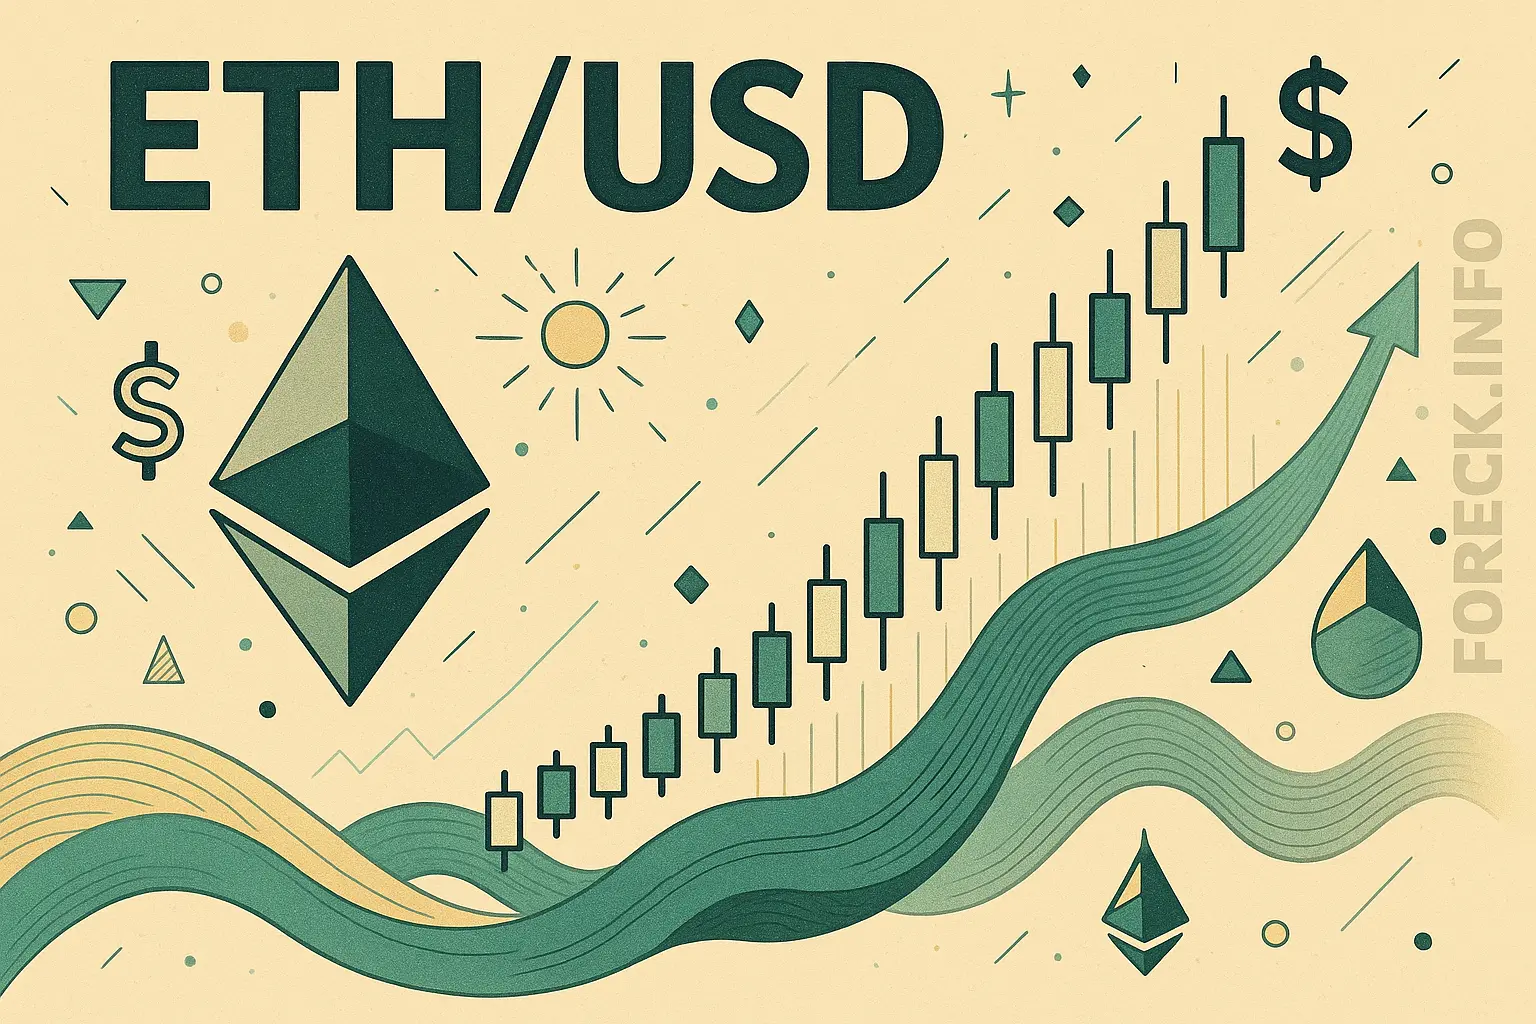
The ETH/USD pair is trading within a medium-term bearish trend, forming a corresponding channel. However, in early February, prices shifted into a predominantly sideways range of 2187.50–1875.00 (Murray levels [3/8]–[2/8]) and may once again form a “flag” pattern within the broader downtrend.
The crypto market crash in early February hit Bitcoin hard, but XRP suffered even more. At certain points, the Ripple token declined significantly faster than the market leader, falling to as low as $1.15. Recently, however, the first signs of stabilization have begun to emerge.
Ethereum aims to technically eliminate censorship at the protocol level. A new upgrade is designed to enforce the inclusion of every valid transaction.
Ethereum Classic is emerging as one of the top performers of the day in the crypto market. Following the breakout, the $10 level is once again within reach.
This week, the SOL/USD pair has resumed a moderate decline within a long-term downtrend and is trading near 82.40, pressured by geopolitical and trade-related uncertainty as well as expectations that current U.S. monetary policy will remain in place for an extended period. The situation in the Middle East remains tense: while U.S.–Iran talks on a nuclear deal have shown some progress, a formal agreement is unlikely in the near term. Moreover, as the White House increases its military presence around the Islamic republic, the risk of a direct confrontation is rising. In this environment, investors continue to favor safe-haven assets—primarily gold—while viewing cryptocurrencies as an unreliable store of value.
During the Asian session, the XRP/USD pair remains within a long-term downtrend, forming a corresponding descending channel. Over the weekend, prices attempted a corrective move and tested the upper boundary at 1.6420 (61.8% Fibonacci retracement) but failed to break higher and gave back part of the gains, stabilizing near 1.4800.
The ETH/USD pair remains within a medium-term downtrend, forming a corresponding descending channel: in the middle of last month, prices reached its upper boundary at 3353.00 but failed to break higher and moved into a correction, during which they fell to the October 2023 lows near 1746.00.