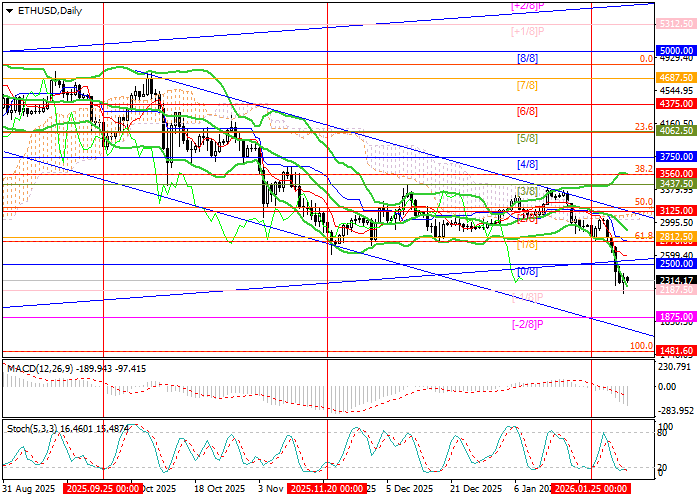
The ETH/USD pair traded for an extended period within a sideways range of 3437.50–2770.00 (Murrey level [3/8], 61.8% Fibonacci retracement), but last week it exited this range after breaking below the lower boundary and resumed movement within a descending channel. Yesterday, the price tested the 2187.50 level (Murrey level [–1/8]) near the June lows. A breakdown below this area would likely open the way toward 1875.00 (Murrey level [–2/8]) and 1481.60 (100.0% Fibonacci retracement). However, if the price manages to consolidate above the 3165.00–3125.00 resistance zone (50.0% Fibonacci retracement, Murrey level [2/8]), an upside breakout from the range could occur, signaling a trend reversal and opening the path for growth toward 3750.00 (Murrey level [4/8]) and 4062.50 (Murrey level [5/8], 23.6% Fibonacci retracement).
Technical indicators continue to point to a sell signal: Bollinger Bands are turning lower, the MACD histogram is expanding in negative territory, and the Stochastic oscillator has entered oversold territory, which does not rule out a limited corrective rebound.
It is also worth noting that on the weekly chart, Bollinger Bands are turning downward, while the price action has completed a “flag” pattern within a downtrend, increasing the likelihood of further negative dynamics in the medium term.
Support and resistance levels
Resistance levels: 3165.00, 3750.00, 4062.50.
Support levels: 2187.50, 1875.00, 1481.60.
Trading scenarios and ETH/USD forecast
Short positions can be opened below the 2187.50 level with targets at 1875.00 and 1481.60, and a stop-loss at 2435.00. Time horizon: 5–7 days.
Long positions can be opened above the 3165.00 level with targets at 3750.00 and 4062.50, and a stop-loss at 2800.00.
Scenario
| Timeframe |
Weekly |
| Recommendation |
SELL STOP |
| Entry point |
2187.45 |
| Take Profit |
1875.00, 1481.60 |
| Stop Loss |
2435.00 |
| Key levels |
1481.60, 1875.00, 2187.50, 3165.00, 3750.00, 4062.50 |
Alternative scenario
| Recommendation |
BUY STOP |
| Entry point |
3165.05 |
| Take Profit |
3750.00, 4062.50 |
| Stop Loss |
2800.00 |
| Key levels |
1481.60, 1875.00, 2187.50, 3165.00, 3750.00, 4062.50 |
John Isige is an experienced cryptocurrency journalist and market analyst specializing in digital assets, blockchain innovation, and emerging Web3 trends. He provides clear, actionable market insights for traders and investors, with particular expertise in DeFi, smart contracts, NFTs, RWAs, and AI-powered blockchain ecosystems. His commentary and analysis have been featured in FORECK.INFO, CoinGape, CryptoNews, and other leading digital finance publications


