
Top Pick

- Fully licensed and regulated US exchange
- Strong focus on security and compliance
- User-friendly interface for beginners

The cryptocurrency market strengthened earlier this week but came under sharp selling pressure on Thursday, erasing much of its previous gains. In the latest market snapshot, Bitcoin (BTC) is trading near 81600.00 (+0.9%), Ethereum (ETH) at 2400.00 (+2.1%), Tether (USDT) at 0.9991 (–0.01%), BNB at 744.00 (+5.1%) and XRP at 1.3250 (+4.8%). Total cryptocurrency market capitalization has declined to approximately $2.73 trillion, while Bitcoin dominance has increased to 60.0%. From October 19 to 22, US spot Bitcoin ETFs recorded net inflows of $439.1 million, while Ethereum ETFs saw outflows of $225.1 million. The market remains volatile despite the recovery attempt discussed in our previous crypto weekly review.

 By John Isige
 Cardano’s Midnight project is sliding sharply. Here is how far the price could still fall. With more than 57,000 registered users, growth of over 300% since the Glacier Drop, and a market capitalization of around 870 million US dollars, Midnight continues to show strong fundamentals.
 By John Isige
 This week, the SOL/USD pair attempted to break out of the sideways range of 91.00–75.00, where it had been trading for about two months, and climbed to seven-week highs near 97.55. A firm move above 100.00 (Murray level [4/8]) would be expected to open the way for further growth toward 125.00 (Murray level [6/8]) and 137.50 (Murray level [7/8], 50.0% Fibonacci retracement). However, if the price consolidates below 91.00, it would likely return to the range and resume negative dynamics toward 75.00 (Murray level [2/8]), 62.50 (Murray level [1/8]), and 50.00 (Murray level [0/8]).
 By John Isige
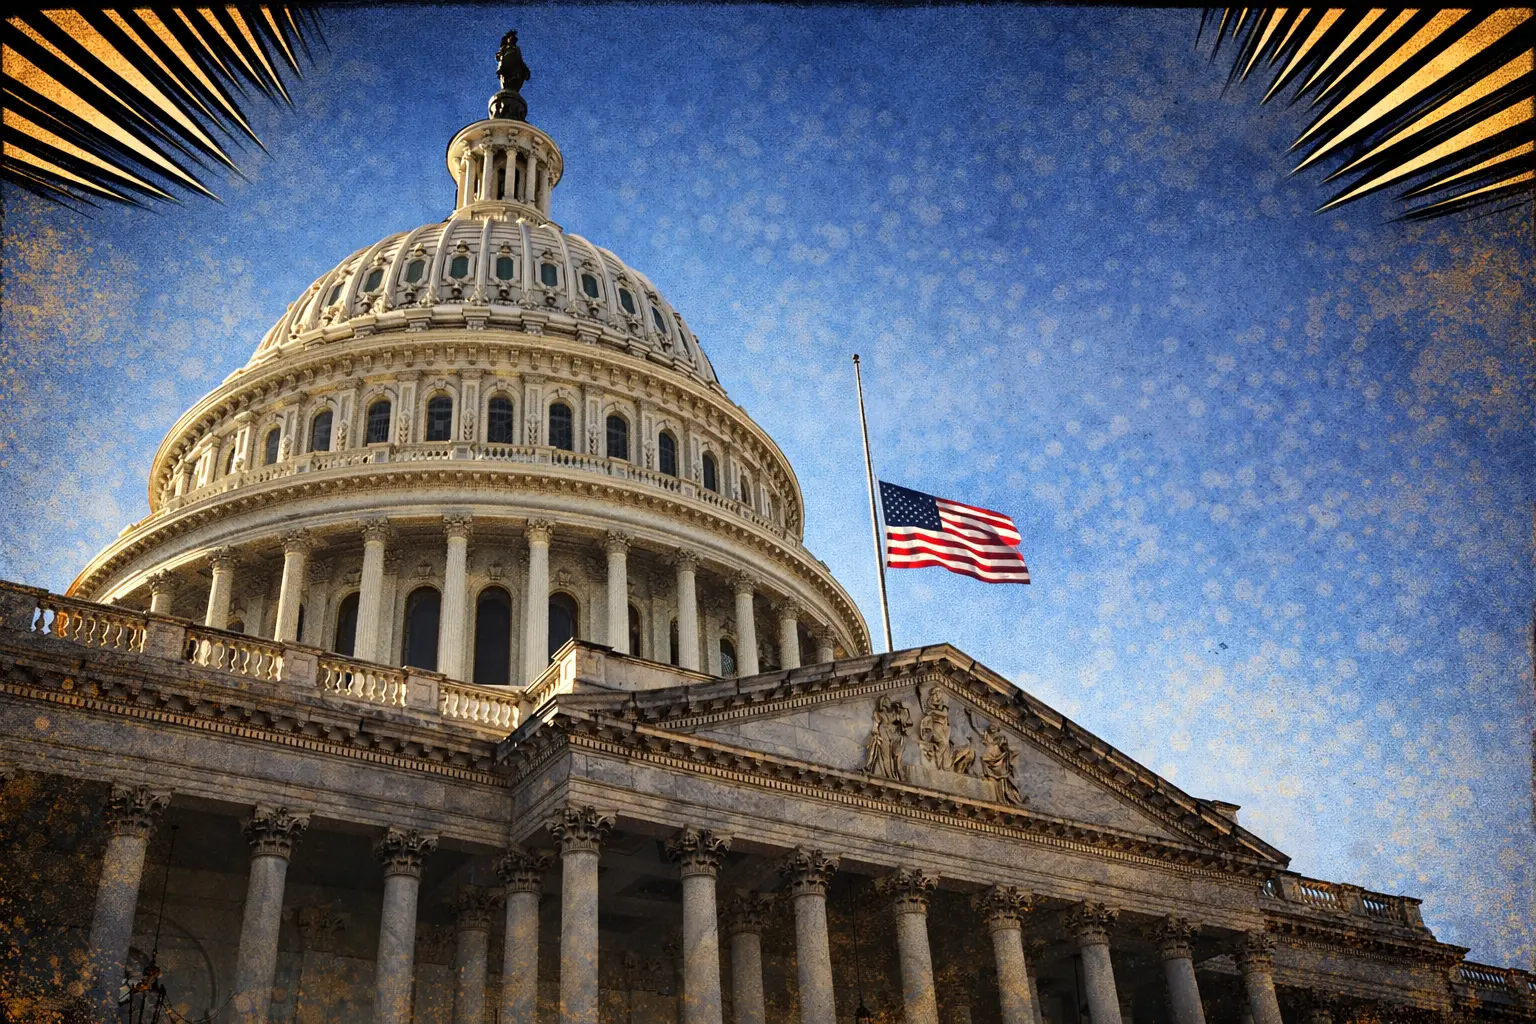
 The stalled US crypto bill is beginning to move again. In the Senate, a possible compromise is emerging around one of the most disputed issues — whether stablecoins should be allowed to generate interest.

 By Andrew Bennett
 The U.S. Securities and Exchange Commission (SEC), together with the Commodity Futures Trading Commission (CFTC), has published a 68-page guidance document that for the first time provides a detailed explanation of the legal status of cryptocurrencies in the United States. According to the document, a significant share of digital assets does not fall under federal securities laws.
 By Andrew Bennett
 Tally, the governance platform that powered voting for more than 500 DAOs, including Arbitrum, Uniswap, and ENS, has announced that it is shutting down after six years of operation. CEO Dennison Bertram said the decision was driven by major shifts in the market.
 By Andrew Bennett
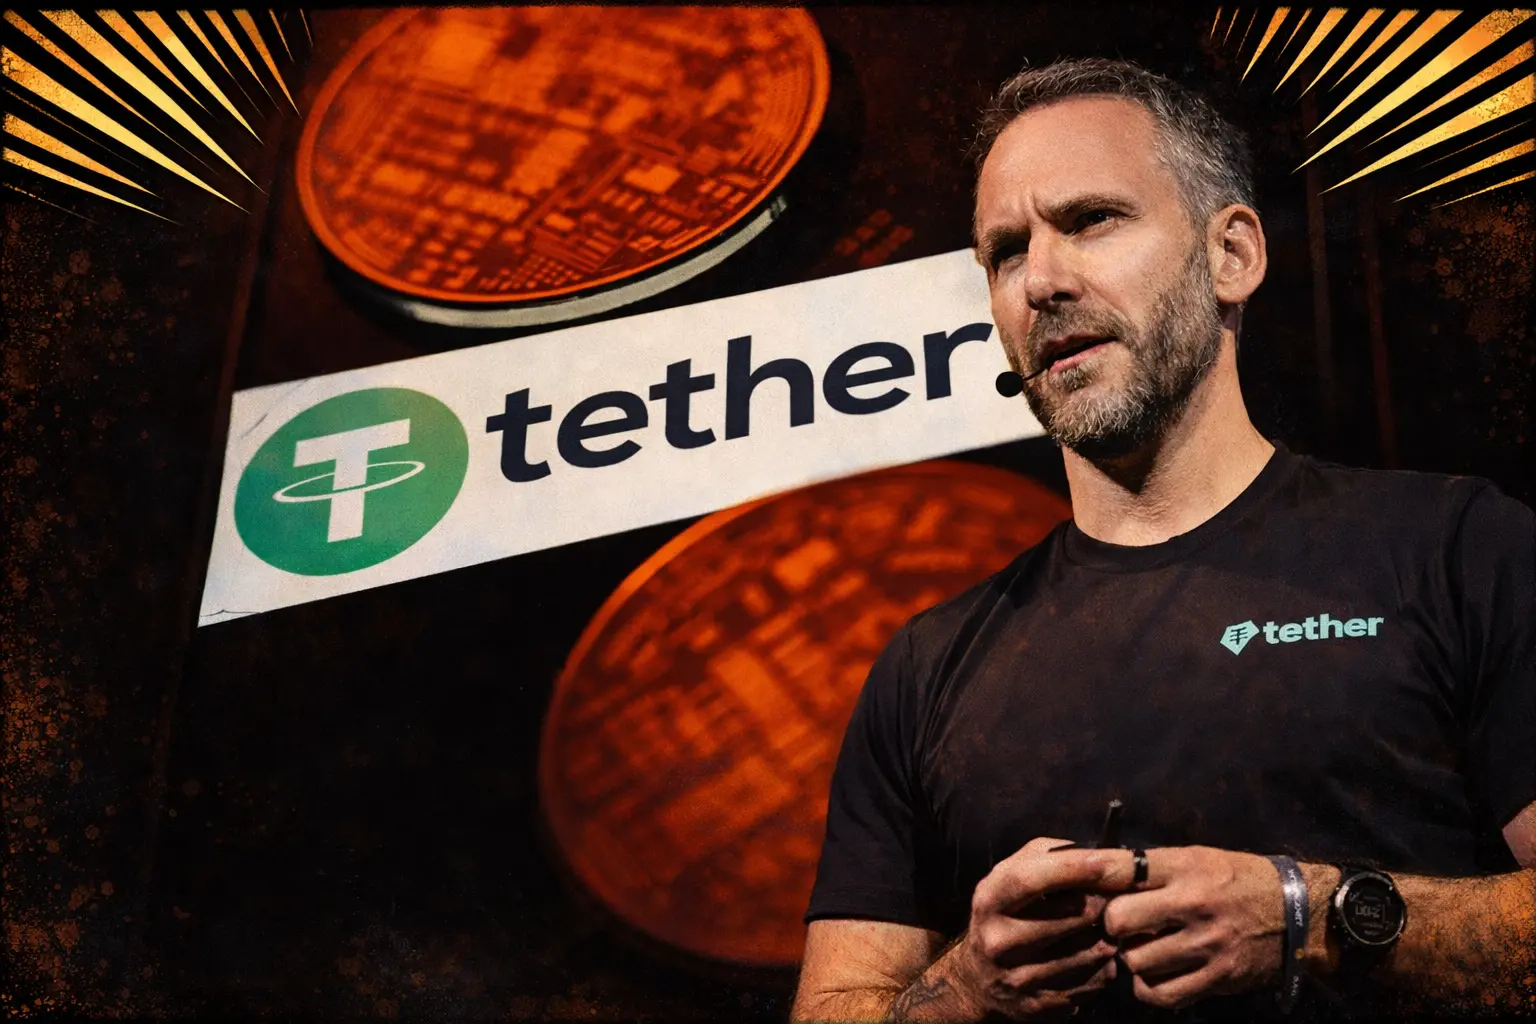
 Tether’s new QVAC Fabric tool makes it possible to train large artificial intelligence models even on ordinary laptops and smartphones. The issuer of the USDT stablecoin announced what it described as a technological breakthrough with the launch of a cross-platform LoRA framework for BitNet models, or 1-bit LLMs. The solution is designed to lower the barriers to AI development, as training models with billions of parameters previously required expensive Nvidia enterprise systems or costly cloud infrastructure.
 By John Isige
 PayPal is continuing to scale its PYUSD stablecoin globally. In the near future, the US dollar-pegged token is expected to become available in around 70 markets, significantly expanding its reach beyond the United States and strengthening the company’s position in the digital payments sector. That is according to a report from Fortune citing sources familiar with the matter.
 By Andrew Bennett
 Ripple’s stablecoin is growing rapidly and raising more questions among XRP holders. Launched only in December 2024, RLUSD has already reached a market capitalization of around 1.5 billion dollars. For Ripple, this is clearly a major success, but for investors it is also creating growing uncertainty.
 By John Isige
 The XRP/USD pair has been trading within a sideways range of 1.5625–1.3671 (Murray levels [4/8]–[3/8]) for the second consecutive month and is attempting an upward move this week, testing the upper boundary of the range. A breakout and consolidation above this level, as well as above 1.6420 (61.8% Fibonacci retracement), could signal a shift in the current trend and open the way toward targets at 1.9531 (Murray level [6/8]) and 2.3437 (Murray level [8/8], 38.2% Fibonacci retracement).
 By Andrew Bennett
 World Liberty Financial token holders must now lock their WLFI for nearly six months in order to take part in governance voting. The new rule was approved on the Snapshot platform, where the proposal received 99.12% support from 1,800 votes. More than 76% of the voting power, however, came from just ten participants.

 By Sagar Dua
 Bitcoin has found support from macroeconomic factors and renewed capital inflows into ETFs. The key question now is how sustainable the current rally will be ahead of the Federal Reserve’s next interest rate decision.
 By John Isige
 Crypto trading and lending firm BlockFills has filed for Chapter 11 bankruptcy protection after several weeks of financial strain and a temporary suspension of client withdrawals. The petition was submitted by Reliz Ltd., the entity operating the business, to the U.S. Bankruptcy Court for the District of Delaware on Sunday. Three affiliated entities also sought bankruptcy protection alongside it.


For crypto, the framework is similar to traditional financial markets but comes with its own twist. Here, price action turns on liquidity, adoption, regulation, and flows from institutions alongside retail sentiment. Network health—hash rate, staking, active wallets—adds another layer. Macro still matters too: rates, dollar strength, and risk appetite shape inflows and outflows. Then, as with any market, you use the chart—trend, support and resistance, momentum, and volume—to spot setups and manage risk.