
Top Pick

- Fully licensed and regulated US exchange
- Strong focus on security and compliance
- User-friendly interface for beginners

The cryptocurrency market strengthened earlier this week but came under sharp selling pressure on Thursday, erasing much of its previous gains. In the latest market snapshot, Bitcoin (BTC) is trading near 81600.00 (+0.9%), Ethereum (ETH) at 2400.00 (+2.1%), Tether (USDT) at 0.9991 (–0.01%), BNB at 744.00 (+5.1%) and XRP at 1.3250 (+4.8%). Total cryptocurrency market capitalization has declined to approximately $2.73 trillion, while Bitcoin dominance has increased to 60.0%. From October 19 to 22, US spot Bitcoin ETFs recorded net inflows of $439.1 million, while Ethereum ETFs saw outflows of $225.1 million. The market remains volatile despite the recovery attempt discussed in our previous crypto weekly review.

 By John Isige
 Last week, the BTC/USD pair broke out of the medium-term sideways range of 70000.00–62500.00, moving above its upper boundary, and today reached two-month highs near 74370.00.

 By Andrew Bennett
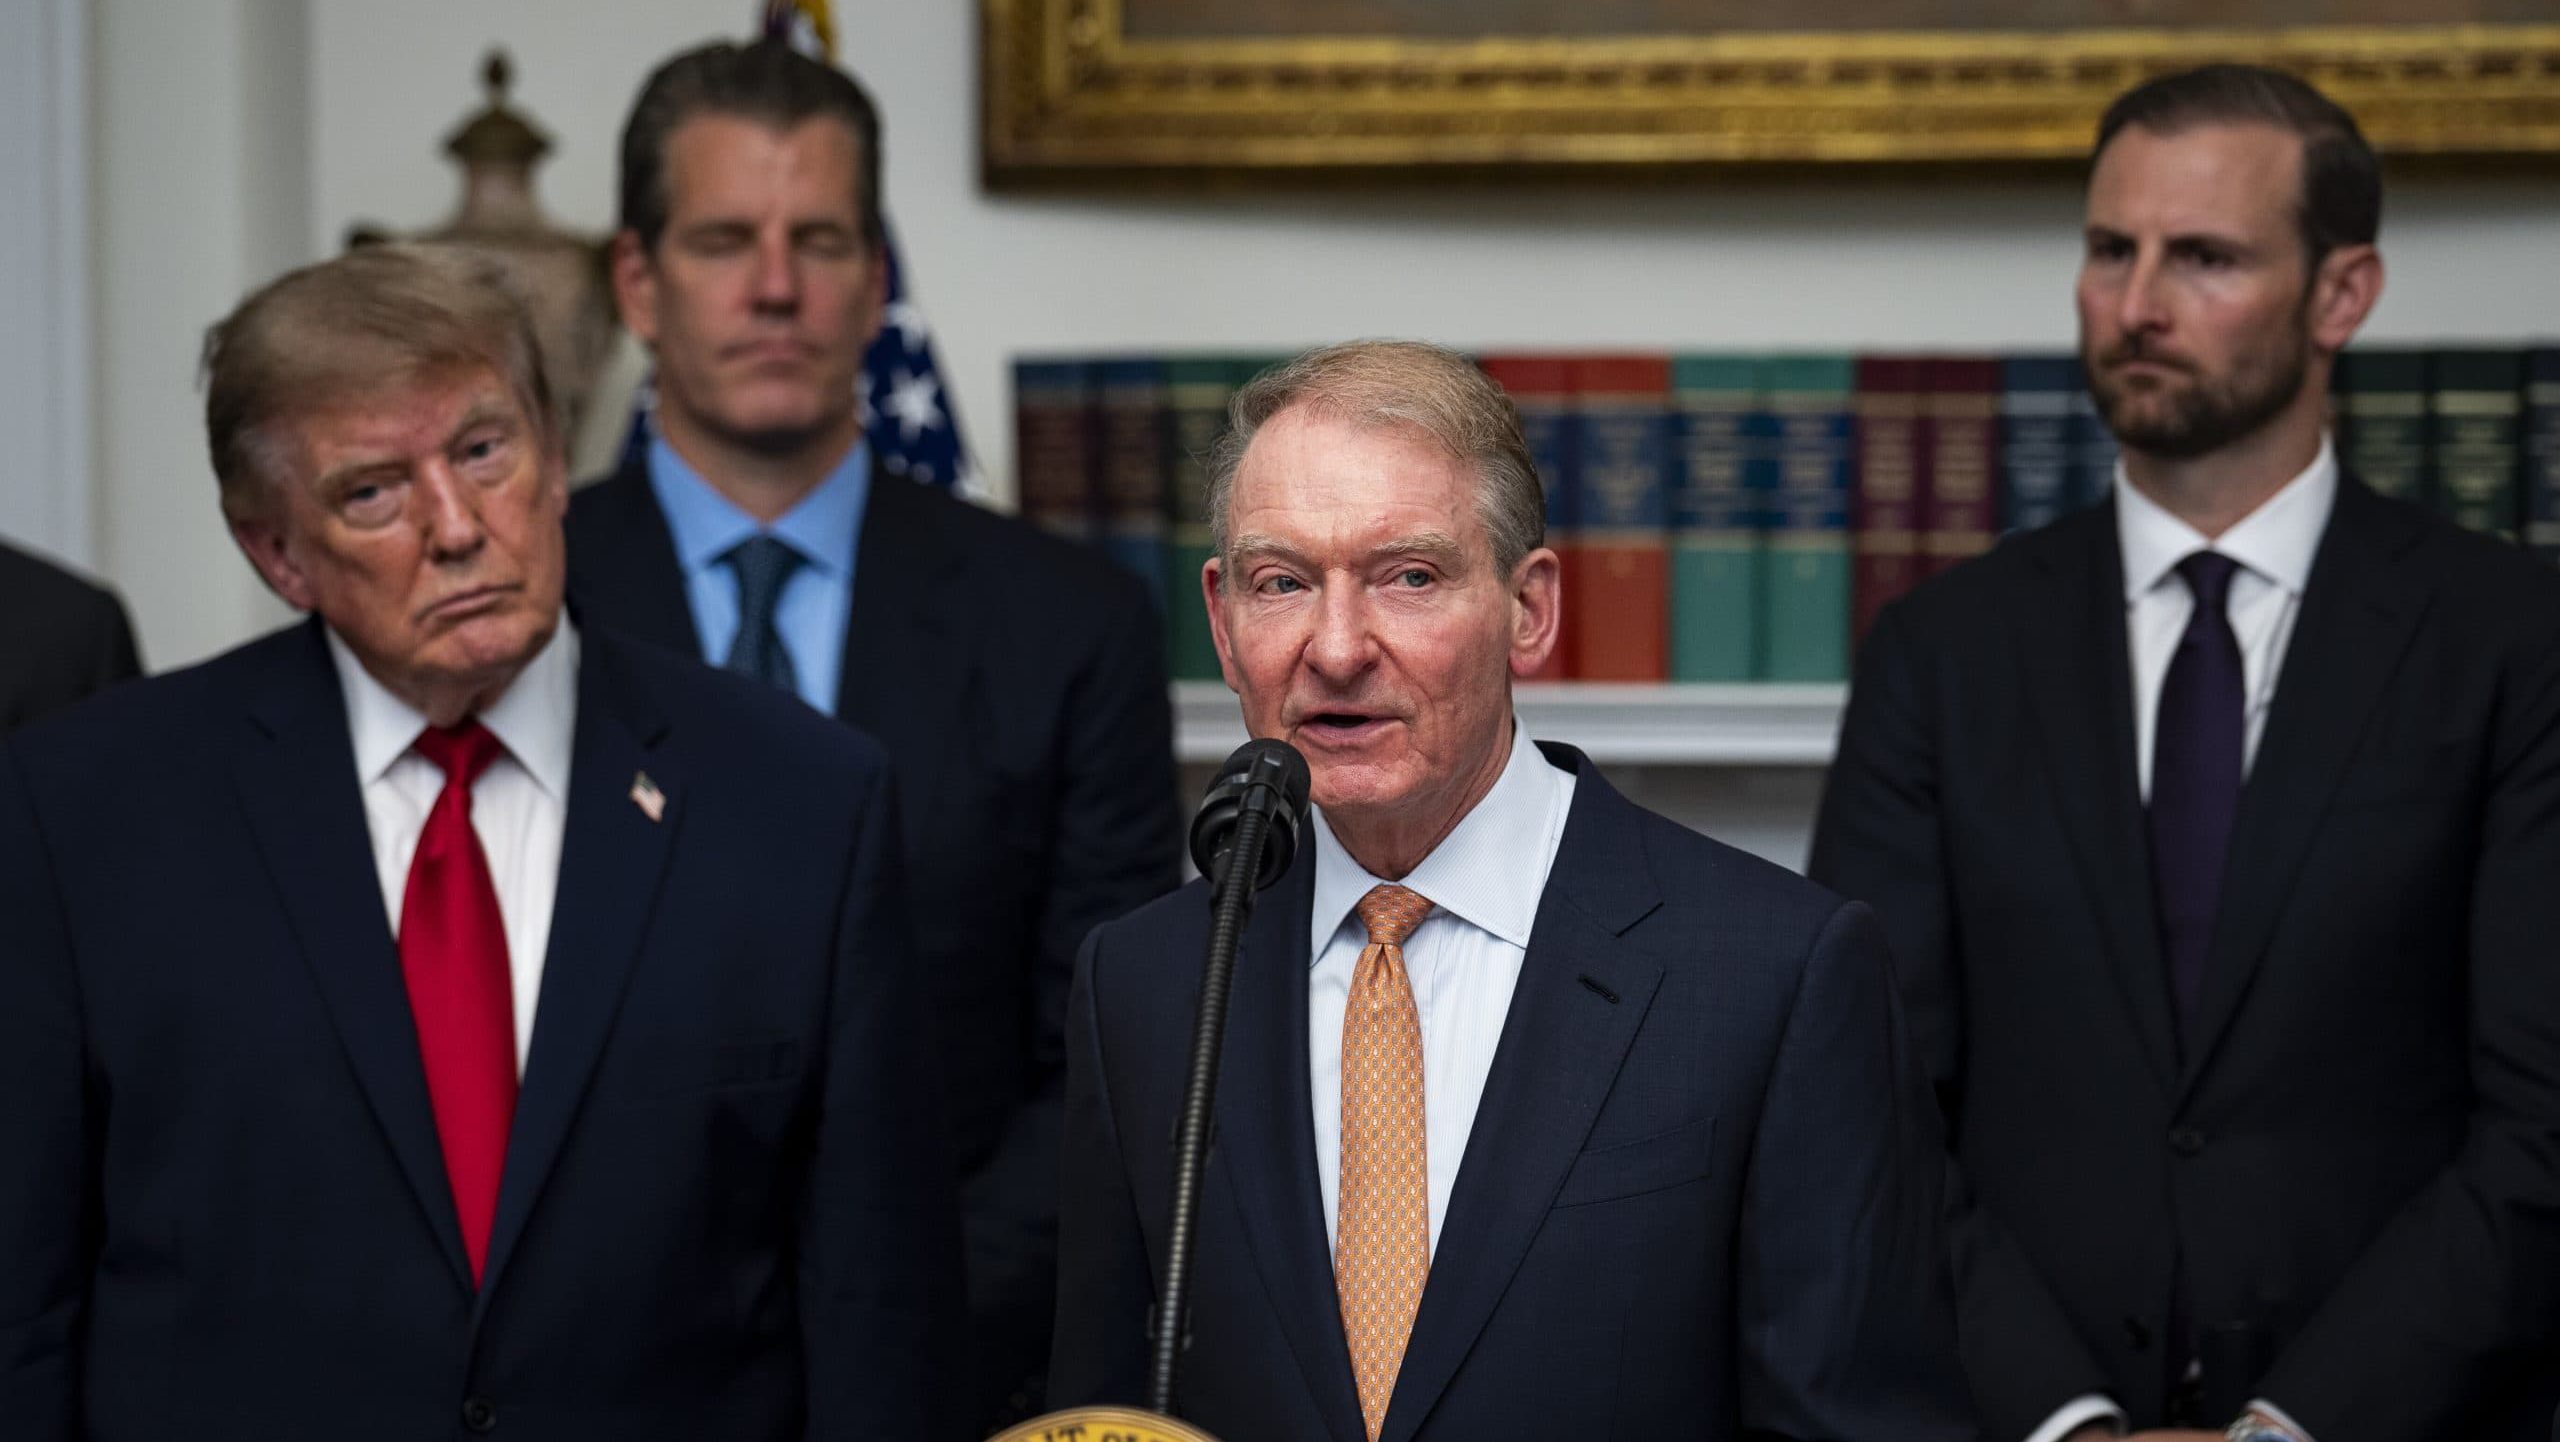
 Donald Trump, once celebrated by many as the “crypto president,” has disappointed part of the Bitcoin community with his strategic reserve initiative. Despite bold promises that the United States would become a “Bitcoin superpower” and the “crypto capital of the world,” the White House has still not started buying BTC one year after signing the executive order that created the Strategic Bitcoin Reserve.
 By John Isige
 Since the start of the Iran war, financial markets have been showing an unusual pattern: Bitcoin has been outperforming both stocks and gold. While there is still no clear winner in the geopolitical conflict, markets have already found a standout leader among major assets.
 By John Isige
 The Ethereum Foundation has sold part of its reserves to a treasury company for the second time. This time, the buyer was BitMine, the firm associated with Tom Lee.
 By Andrew Bennett
 A crypto exchanges Coinbase post on Thursday pointed to what may be the next stage in the development of the U.S. crypto fund market. According to reports, BlackRock launched the iShares Staked Ethereum Trust ETF under the ticker ETHB on Nasdaq on March 12. Unlike the first U.S. spot Ether funds that began trading in July 2024, ETHB is designed not only to hold spot ETH but also to generate income by staking part of those holdings.
 By John Isige
 Bitcoin fell sharply after a U.S. strike on an Iranian oil island. At the same time, the Iranian regime outlined its first conditions for a possible reopening of the Strait of Hormuz.
 By Andrew Bennett
 Tether is preparing a major push into the U.S. crypto market. The company’s new dollar-backed stablecoin could become a direct challenger to banks and payment systems, including credit cards.
 By John Isige
 Bitcoin continues to surprise investors with its resilience amid the war with Iran, giving crypto market participants reasons for cautious optimism. However, investment strategist Luke Gromen is urging against rushing into new BTC purchases, arguing that the current situation remains highly ambiguous.
 By John Isige
 The cryptocurrency market showed moderate growth this week: BTC is trading around 71,500.00 (+6.9%), ETH is near 2,100.00 (+7.6%), USDT remains around 0.9999 (+0.01%), BNB is trading close to 660.00 (+7.0%), and XRP is holding near 1.4100 (+4.7%). The total market capitalization rose to 2.43 trillion dollars by the end of the week, while Bitcoin’s market dominance declined to 58.8%. At the same time, Bitcoin ETFs recorded inflows of 583.0 million dollars, while Ethereum ETFs attracted 90.7 million dollars.
 By John Isige
 Stocks and oil are experiencing heightened volatility, yet Bitcoin continues to show resilience. A closer look at the derivatives market suggests that cryptocurrencies may be building significant potential for a major move.
 By Andrew Bennett
 The cryptocurrency Hyperliquid (HYPE) continues to move confidently upward. Several factors point to the potential for further growth, while current technical analysis highlights key levels that could guide the price in the coming weeks.
 By John Isige
 A new report examines the potential threat quantum computers could pose to Bitcoin. According to the analysis, roughly one-third of the total BTC supply could theoretically become vulnerable.


For crypto, the framework is similar to traditional financial markets but comes with its own twist. Here, price action turns on liquidity, adoption, regulation, and flows from institutions alongside retail sentiment. Network health—hash rate, staking, active wallets—adds another layer. Macro still matters too: rates, dollar strength, and risk appetite shape inflows and outflows. Then, as with any market, you use the chart—trend, support and resistance, momentum, and volume—to spot setups and manage risk.