
Top Pick

- Fully licensed and regulated US exchange
- Strong focus on security and compliance
- User-friendly interface for beginners

The cryptocurrency market strengthened earlier this week but came under sharp selling pressure on Thursday, erasing much of its previous gains. In the latest market snapshot, Bitcoin (BTC) is trading near 81600.00 (+0.9%), Ethereum (ETH) at 2400.00 (+2.1%), Tether (USDT) at 0.9991 (–0.01%), BNB at 744.00 (+5.1%) and XRP at 1.3250 (+4.8%). Total cryptocurrency market capitalization has declined to approximately $2.73 trillion, while Bitcoin dominance has increased to 60.0%. From October 19 to 22, US spot Bitcoin ETFs recorded net inflows of $439.1 million, while Ethereum ETFs saw outflows of $225.1 million. The market remains volatile despite the recovery attempt discussed in our previous crypto weekly review.

 By Andrew Bennett
 Google introduces the Willow quantum computer that could threaten Bitcoin

 By John Isige
 The initial rally in the cryptocurrency market this week was followed by a correction, after which leading assets began to recover: BTC is trading near 111,000.00 (+1.9%), ETH around 3,950.00 (–1.3%), USDT at 1.0001 (+0.01%), BNB near 1,125.00 (–0.4%), and XRP at 2.4500 (+1.7%). The total market capitalization has reached $3.74 trillion, with Bitcoin’s dominance at 59.2%. Bitcoin ETFs gained $355.7 million, while Ethereum ETFs saw an outflow of $150.3 million.
 By John Isige
 a16z sees Bitcoin and stablecoins as anchors of a new financial order
 By John Isige
 Why Bitcoin Is Rising Toward $148,000
 By John Isige
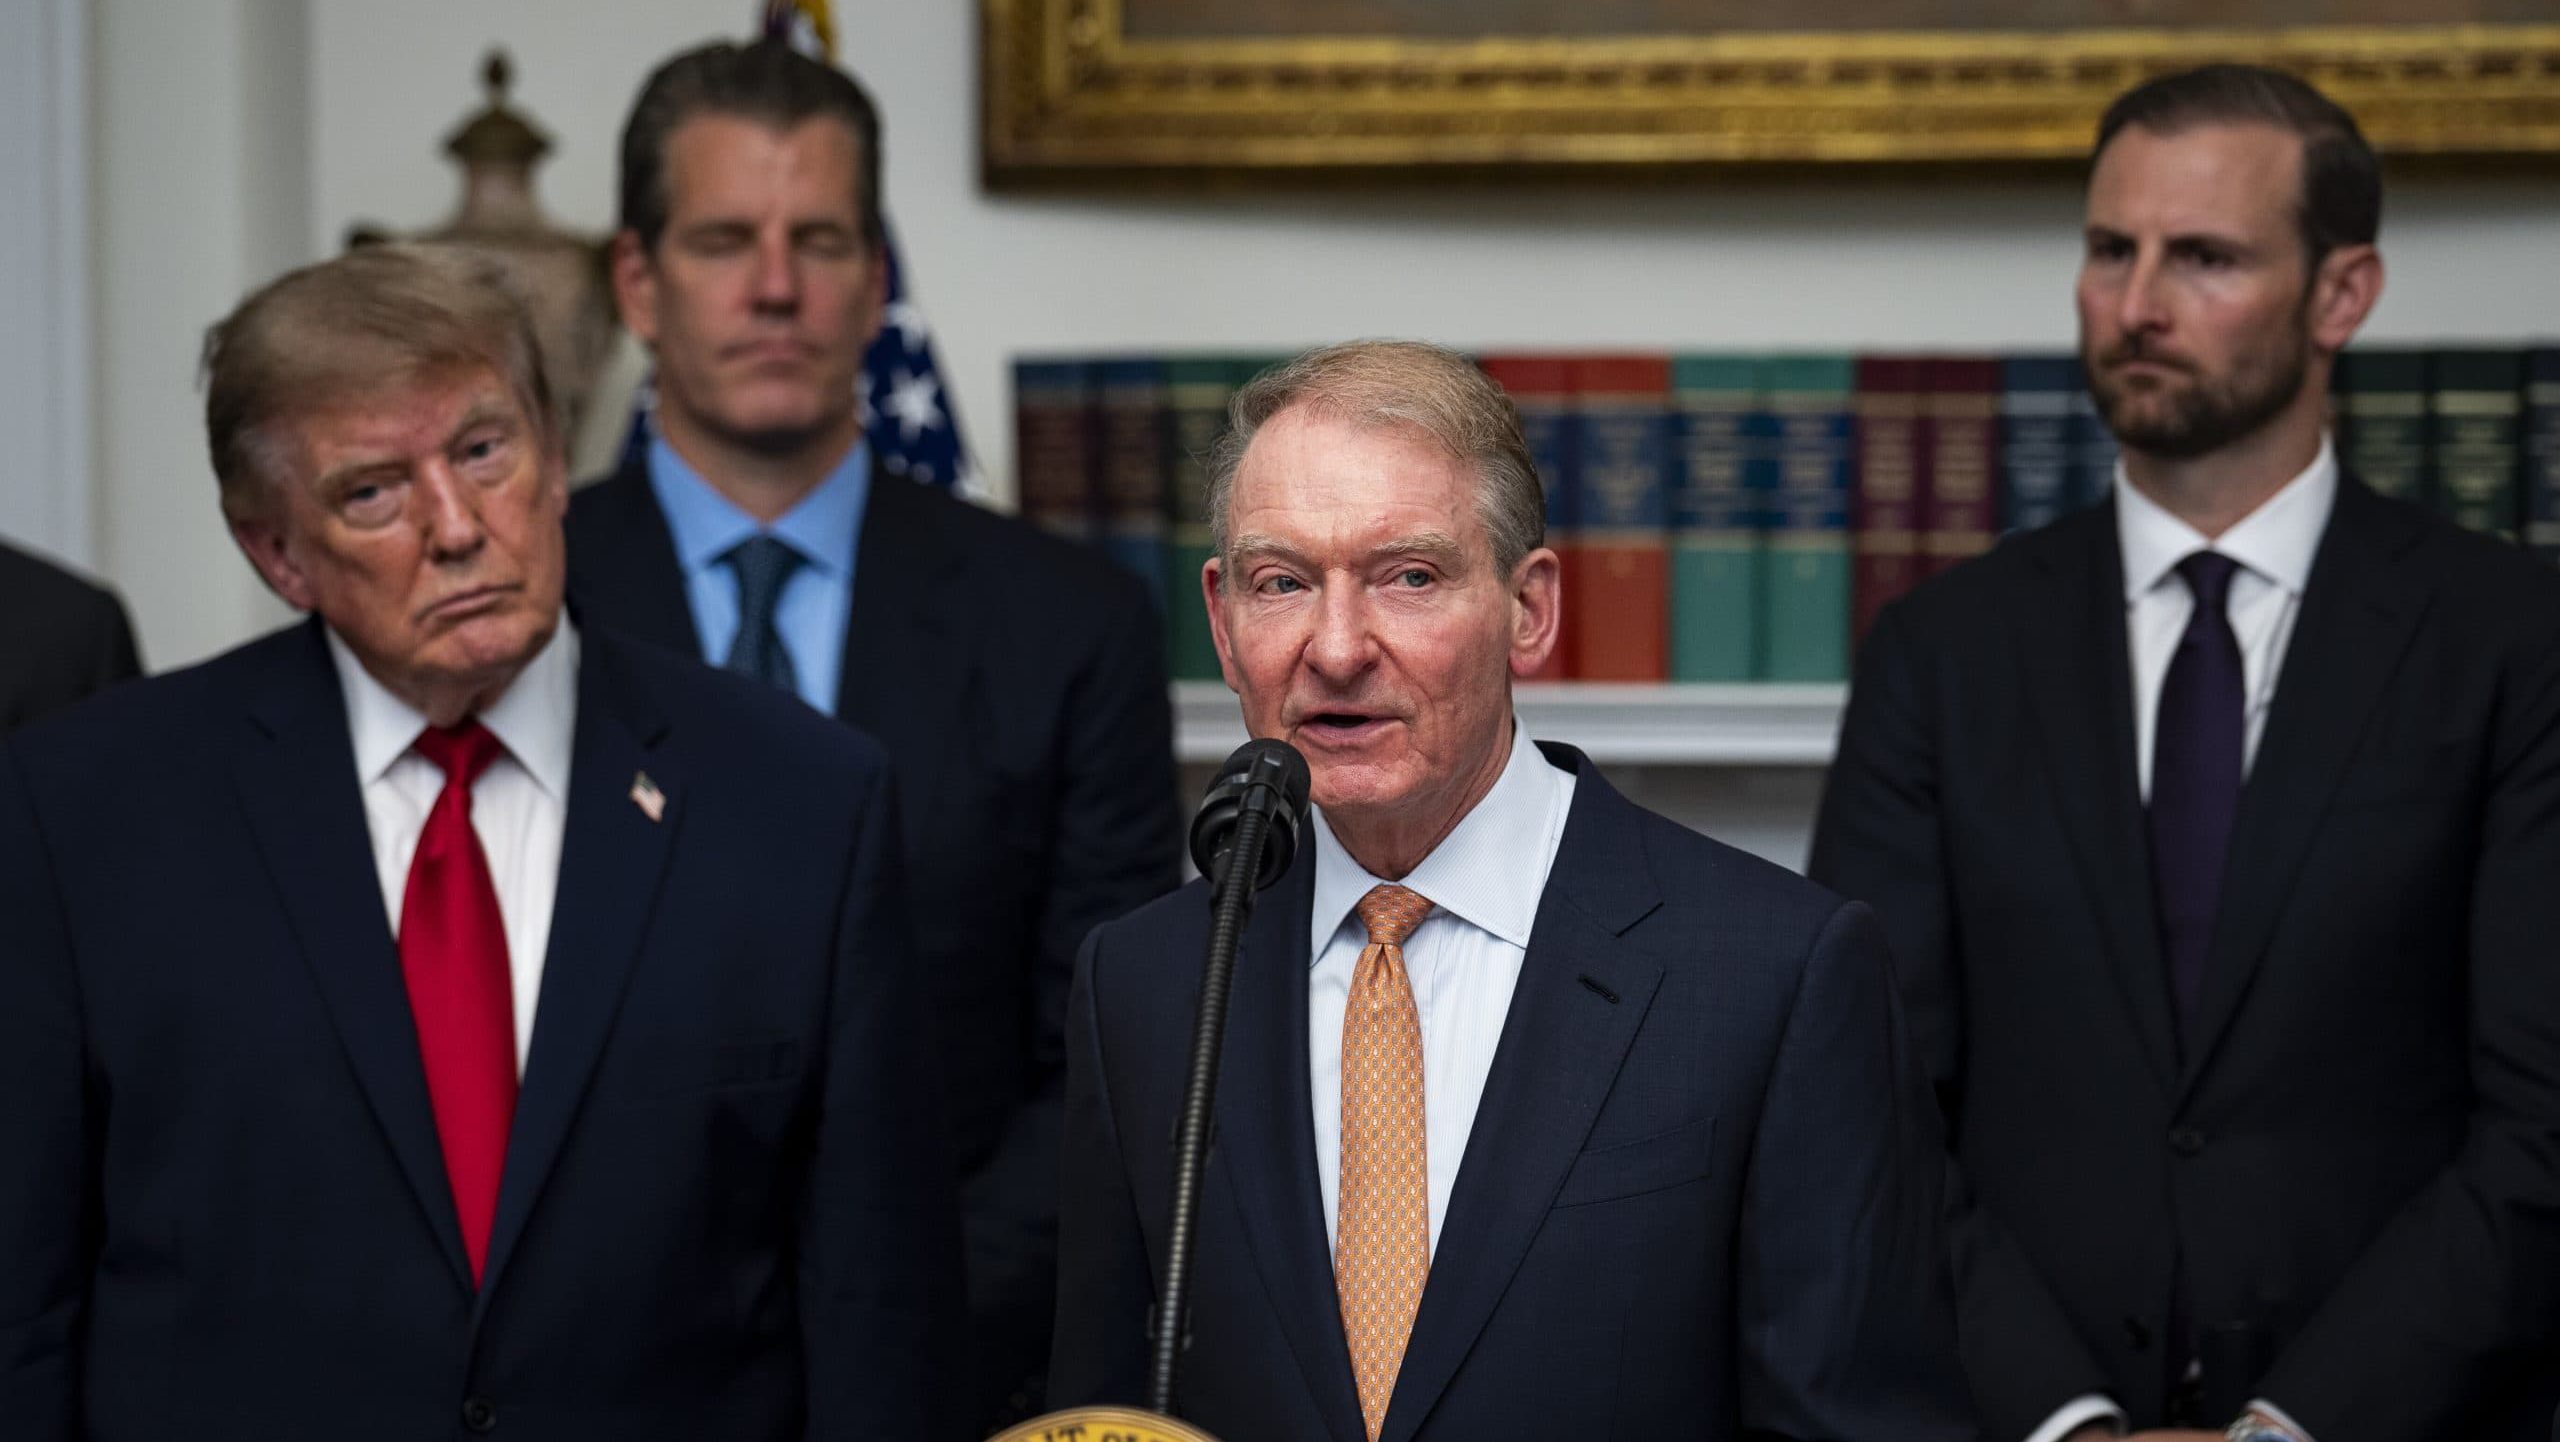
 U.S. President Donald Trump has signed a pardon for Binance founder Changpeng Zhao (CZ), according to The Wall Street Journal, citing sources. The document was reportedly signed on Wednesday, with the decision justified as a response to the “politically motivated prosecution” of Zhao.
 By John Isige
 Revolut Obtains MiCA License and Prepares to Launch New Crypto Platform
 By John Isige
 The SOL/USD pair continues to trade within a long-term upward channel but has been actively testing its lower boundary for the past two weeks, attempting to break below it. Consolidation beneath the support zone of 187.50–183.80 (Murray level [4/8], Fibonacci correction 50.0%) may trigger a decline toward 165.70 (Fibonacci correction 38.2%) and 140.62 (Murray level [1/8], Fibonacci correction 23.6%). The key level for bulls is seen at 203.12 (Murray level [5/8], Fibonacci correction 61.8%): a breakout above it will resume upward momentum toward the upper boundary of the ascending channel through 234.38 (Murray level [7/8]), 250.00 (Murray level [8/8]), and 265.62 (Murray level [+1/8]).
 By John Isige
 In this technical analysis, takes a closer look at Binance Coin (BNB) and outlines the key price levels to watch next.
 By John Isige
 T. Rowe Price files for its first US crypto ETF
 By John Isige
 The XRP/USD pair continues to trade within a medium-term downward trend, forming a consistent bearish channel. Earlier this month, the price attempted to break through the upper boundary near 3.1250 (Murray level [8/8]) but failed to consolidate above it and resumed its decline amid growing risks of a global economic slowdown caused by escalating trade tensions between the U.S. and China. Currently, the price is approaching 2.3438 (Murray level [4/8]); a confirmed break below this level would open the way toward 1.9531 (Murray level [2/8]) and 1.5625 (Murray level [0/8]). The key resistance zone for bulls lies between 2.6220–2.7344 (middle Bollinger band, Murray level [6/8]); a breakout above it could trigger renewed attempts to exit the downward channel and retest the targets at 3.1250 (Murray level [8/8]) and 3.5156 (Murray level [+2/8]), although such a scenario currently seems less likely.
 By John Isige
 FalconX acquires ETF giant 21Shares. Together, the companies plan to develop new funds focused on Bitcoin, Ether, and derivatives.
 By John Isige
 The company SharpLink Gaming has acquired an additional 19,000 Ethereum amid a market pullback, increasing its total crypto holdings to nearly 860,000 ETH, making it one of the largest Ethereum holders among public companies.


For crypto, the framework is similar to traditional financial markets but comes with its own twist. Here, price action turns on liquidity, adoption, regulation, and flows from institutions alongside retail sentiment. Network health—hash rate, staking, active wallets—adds another layer. Macro still matters too: rates, dollar strength, and risk appetite shape inflows and outflows. Then, as with any market, you use the chart—trend, support and resistance, momentum, and volume—to spot setups and manage risk.