
While the result doesn’t trigger a change in leadership, analysts highlight that future economic reforms will now require broader consensus-building and negotiation with opposition parties, a prospect likely to delay or dilute policy measures. Ishiba himself has publicly committed to remain in office through the end of his term, at least until a landmark trade agreement with the United States is concluded.
On the macro front, fresh inflation data released late last week revealed that Japan’s nationwide consumer price index slipped from 3.7% to 3.3% year-on-year in June, reinforcing expectations that the Bank of Japan (BoJ) could raise its key interest rate at the upcoming meeting. Despite slowing price pressures, the BoJ’s stance is increasingly scrutinized as global monetary policy diverges and the yen’s weakness sustains imported inflation.
Dollar Retains Strength as Markets Eye Fed and Trade Policy
Meanwhile, the US dollar continues to strengthen, with the USDX hovering near 98.10—well off the annual lows. Market participants are awaiting further comments from President Donald Trump regarding future trade policy, although reactions to his “hawkish” rhetoric have become more muted compared to earlier this year. The consensus among traders seems to be that the White House’s aggressive posturing is increasingly a negotiating tool rather than a signal of immediate escalation.
On Friday, Federal Reserve Governor Christopher Waller delivered a notable speech, backing an interest rate cut at the end of July. According to Waller, tariff increases are likely to have only a limited impact on inflation, while labor market fundamentals remain solid. These comments add further nuance to Fed rate expectations and could influence near-term volatility for both the US dollar and risk assets.
Support and Resistance Levels: Technical Outlook
The daily USD/JPY chart depicts an ongoing corrective climb within an established upward channel. Price action is attempting a fresh push toward channel resistance between 151.00 and 144.00.
Technical indicators remain broadly supportive of further upside: fast EMAs on the Alligator indicator sit above the signal line, and the Awesome Oscillator (AO) histogram prints fresh bullish bars above the zero threshold.
- Support Levels: 147.40, 143.40
- Resistance Levels: 149.20, 152.60
Trade Scenarios
- If price breaks and sustains above 149.20, long positions targeting 152.60 become favorable. Suggested stop-loss: 148.00. (Timeframe: 7+ days)
- If price falls and holds below 147.40, short setups toward 143.40 are in play. Suggested stop-loss: 149.00.
Key Levels (Weekly Outlook)
- 143.40
- 147.40
- 149.20
- 152.60
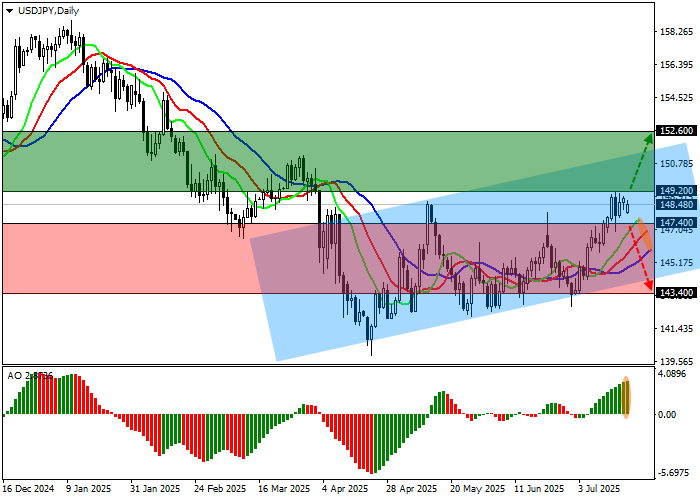 USD/JPY — technical chart