

The inflation print was largely driven by a sharp increase in rates and local authority charges (up 12.2%), only partially offset by an 8.0% drop in gasoline prices. Rental costs rose by 3.2%—the slowest pace in four years. Overall, the data aligned with consensus expectations and is unlikely to trigger a shift in RBNZ’s policy stance regarding interest rates.
Macro Context: USD Holds Firm as Fed Guidance Eyed
The US dollar index (USDX) is holding steady at 98.10, with trading activity muted as investor focus moves from White House tariff headlines to macroeconomic data and Federal Reserve forward guidance. Last Friday, Federal Reserve Governor Christopher Waller stated he would support a rate cut at July’s FOMC meeting, citing limited inflationary pressure from sanctions. In contrast, his colleague Austan Goolsbee voiced caution, emphasizing the impact of export taxes observed in July’s CPI report, and suggested that the current monetary stance remains appropriate with no immediate need for adjustments.
Technical Picture: Support and Resistance Levels
NZD/USD is holding just above the lower boundary of its ascending channel, which is defined by dynamic support and resistance between 0.6200 and 0.5950.
Technical indicators signal increasing bearish pressure: fast EMAs on the Alligator indicator are diverging further below the signal line, while the Awesome Oscillator (AO) histogram prints a sequence of corrective bars in negative territory.
- Resistance Levels: 0.6000, 0.6120
- Support Levels: 0.5910, 0.5760
Trade Setups
- Sell scenario: Short positions can be considered on a breakdown and close below 0.5910, targeting 0.5760. Stop-loss: 0.6000. Time horizon: 7+ days.
- Buy scenario: Long positions are viable on a sustained move above 0.6000, targeting 0.6120. Stop-loss: 0.5930.
Key Levels for Weekly Trading
- 0.5760
- 0.5910
- 0.6000
- 0.6120
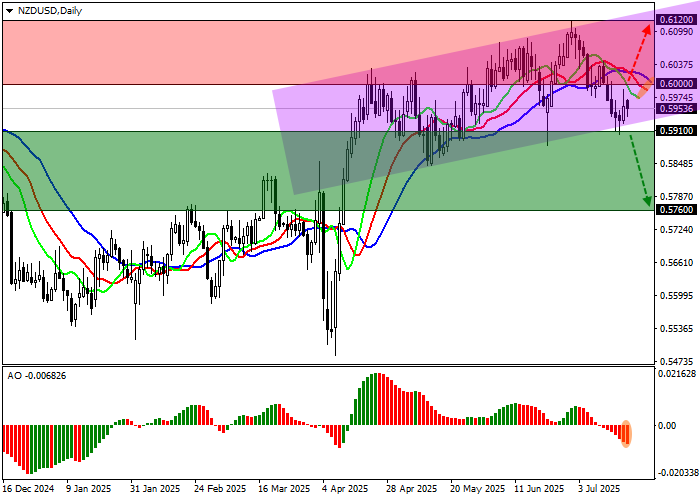 NZD/USD — Q2 inflation and support/resistance