

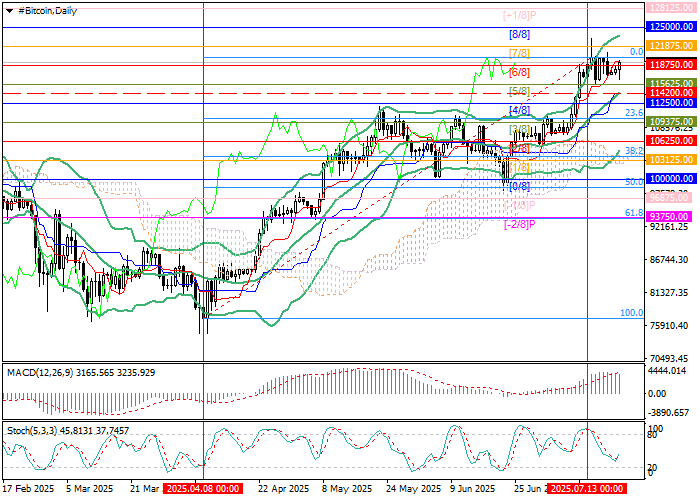
However, following the release of June’s inflation report—showing annual CPI accelerating from 2.4% to 2.7% and the core index moving from 2.8% to 2.9%—bitcoin corrected downward to the 118,750.00 region, where it remains in consolidation.
BTC/USD Holds Near 123,200.00 Amid US Inflation Shock
Currently, the bitcoin price is navigating conflicting influences. On one hand, bullish momentum is supported by the US Congress passing several crypto-focused legislative acts; on the other, upward movement is constrained by persistent concerns that the Federal Reserve will maintain high interest rates for an extended period. Notably, the House of Representatives debated major regulatory frameworks for stablecoins, crypto market structure and transparency, and federal oversight of central bank digital currencies (CBDCs). The stablecoin bill mandates full 1:1 reserve backing in US dollars or equivalent money market instruments, and requires public disclosure and third-party audit of reserves. A controversial provision prohibits issuers from paying interest or yield to holders and users
The crypto sector’s new legal foundation was widely welcomed by investors, though experts caution that crypto-skeptic coalitions may still obstruct implementation. For example, US banking and credit union associations have already petitioned the Office of the Comptroller of the Currency (OCC) to pause stablecoin charter approvals, citing systemic risk concerns
Support and Resistance Levels
Technically, BTC/USD is holding above the 118,750.00 level (Murray [6/8]). A breakout above this region will reinforce the case for further gains, with bullish targets at 125,000.00 (Murray [8/8]) and 128,125.00 (Murray [+1/8]). For bears, the middle Bollinger Band near 114,200.00 is a key pivot: a decisive break below this area could open the way for a deeper retracement toward 109,375.00 (Murray [5/8], Fibonacci 23.6% retracement) and 103,125.00 (Murray [1/8], Fibonacci 38.2% retracement).
Technical indicators remain supportive of a bullish trend: Bollinger Bands continue to expand upward, MACD holds firm in positive territory, and the stochastic oscillator is also turning higher.
- Resistance Levels: 118,750.00, 125,000.00, 128,125.00
- Support Levels: 114,200.00, 109,375.00, 103,125.00
 BTC/USD — Technical levels after US inflation data
Trade Setups
- Buy scenario: Enter long from 120,000.00 with targets at 125,000.00 and 128,125.00. Stop-loss: 117,200.00. Horizon: 5–7 days.
- Sell scenario: Open shorts below 114,200.00 with targets at 109,375.00 and 103,125.00. Stop-loss: 117,400.00.
Weekly Technical Plan
- Key levels: 103,125.00, 109,375.00, 114,200.00, 118,750.00, 125,000.00, 128,125.00
