

Binance Coin (BNB), the native token of the world’s largest cryptocurrency exchange, has recently marked an impressive technical achievement by pushing above the critical $860 barrier and establishing a new all-time high. The subsequent consolidation is unfolding within a robust upward-sloping price channel, indicating not only sustained investor interest but also healthy market structure beneath the surface.
The long-term uptrend remains firmly in place as long as the green ascending support line on the daily chart continues to underpin the price action. This structural support reflects ongoing demand and a willingness among buyers to defend higher lows, even as the market undergoes short-term periods of profit-taking and volatility. Currently, BNB is oscillating beneath an overhead resistance band stretching from the upper $800s into the lower $900s—a zone highlighted by increased sell activity from both swing traders and long-term holders looking to secure gains after an extended rally.
Notably, this phase of sideways movement comes after a period of sustained accumulation, as evidenced by both volume trends and on-chain data suggesting an uptick in wallet balances among major holders. This technical “pause” is often viewed as constructive, providing the market with time to digest recent gains and consolidate before potentially embarking on the next leg higher.
Technical Indicators: Bullish Setup, But Signs of Overextension
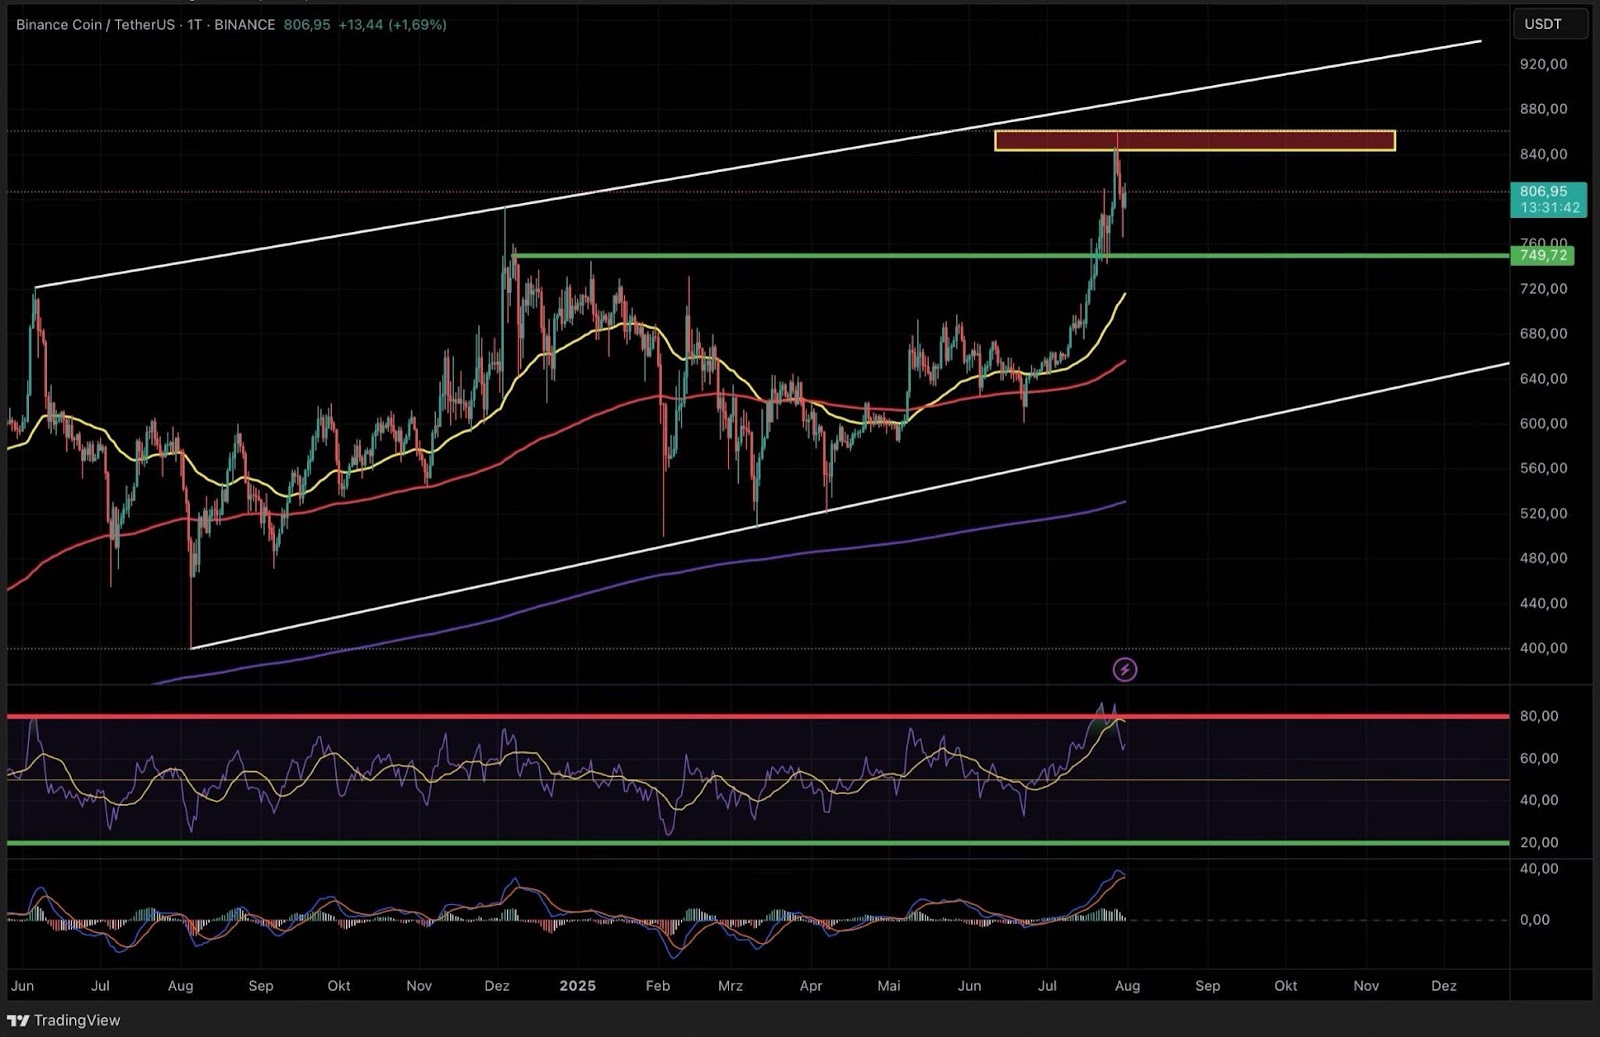 BNB daily chart: trend channel and resistance
Examining the technical landscape, the Relative Strength Index (RSI) remains deep in overbought territory, consistently holding above 70 since the breakout. This reflects aggressive momentum but also flags the risk of an interim pullback or at least a period of lateral consolidation. In past cycles, such extended RSI readings on BNB have often preceded temporary pauses, with subsequent pullbacks typically finding buyers along the major trendline or near the 50-day EMA.
The Moving Average Convergence Divergence (MACD) on the daily chart is starting to flatten, a classic precursor to volatility compression and potential reversal. The histogram bars have diminished, and the signal line gap is narrowing, suggesting that bullish momentum—while still present—may be moderating. This development is consistent with the cooling period observed in the price action itself.
Volume analysis lends further nuance. After the explosive surge to new highs, recent trading sessions have seen volumes contract, which is a typical sign of consolidation. However, the lack of significant selling spikes suggests that large holders are not rushing for the exits; rather, a wait-and-see approach prevails as the market evaluates the next directional catalyst.
4-Hour Chart: Focus on Dynamic Support, Breakout Scenarios
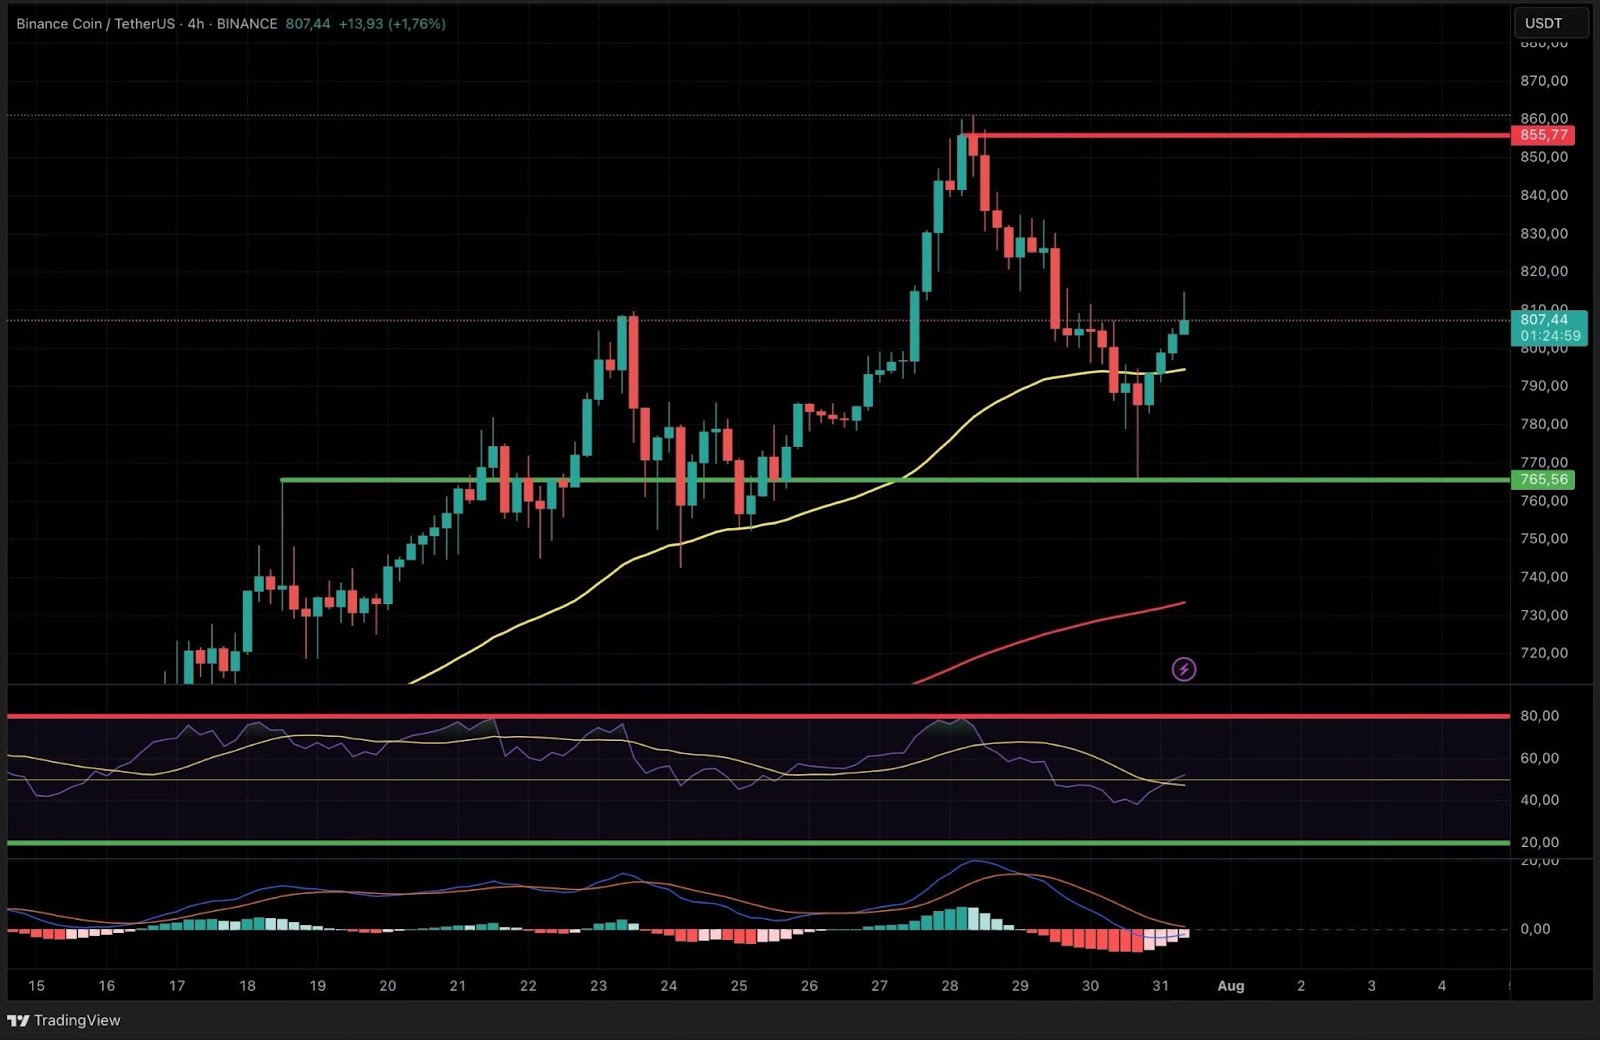 BNB 4h chart: consolidation and breakout watch
On the intraday 4-hour chart, the price continues to respect the 50-period Exponential Moving Average (EMA), which has become the axis of the short-term uptrend. Each test of this moving average has attracted renewed buying interest, reinforcing its status as a critical technical pivot. The RSI on this timeframe has moderated, currently hovering around the 55–60 zone, supporting the idea of underlying strength but leaving room for further upside if bulls regain control.
Attention remains glued to the confluence of the horizontal resistance near $900 and the sloping upper boundary of the current price channel. Should BNB decisively break and close above this area on solid volume, a new bullish impulse toward the psychological $1,000 level becomes increasingly likely. This target is not only a round number but also aligns with projected Fibonacci extension levels—making it a logical magnet for technical traders and momentum-driven flows.
On the flip side, a failure to hold the 50 EMA or a sharp rejection from resistance would open the door to a deeper correction, with initial support seen at the previous breakout zone ($860), and secondary support aligning with the base of the trend channel near $820. The MACD on the 4-hour chart is attempting a bullish crossover, and if confirmed, this could provide the spark needed for another attempt at a breakout.
Market Structure, Sentiment, and Outlook
From a structural perspective, BNB’s uptrend remains well-supported by both technical and fundamental drivers. The ongoing expansion of the Binance ecosystem, continued innovation in DeFi and blockchain solutions, and high-profile exchange launches all feed into the narrative of BNB as a core asset for both retail and institutional investors.
Sentiment indicators reflect a cautiously optimistic market mood. Social metrics and derivatives funding rates show healthy interest, but not the kind of euphoric overextension seen at major market tops. If Bitcoin and Ethereum maintain relative stability, BNB could easily outperform due to its robust order book and dedicated user base.
In summary, the technical backdrop for Binance Coin remains bullish above key supports, and the current consolidation is a constructive setup for a renewed push toward $1,000—provided resistance is cleared with conviction and broader market conditions cooperate. Traders should monitor the interaction with the $900 resistance zone and watch for volume and momentum signals confirming the next major move.